participant
This study was conducted under the Declaration of Helsinki and was approved by the Jichi Medical University Ethics Committee (No. 23-043). Videotapes of past surgeries were analyzed in this study, and patients were given the right to opt out. Written informed consent was obtained from surgeons, subject to a technical evaluation. Six gastric surgeons from the Department of Gastroenterology, General, and Transplant Surgery at Jichi Medical University participated in this study. Three of them were veterans who had performed more than 100 laparoscopic gastrectomies, and three were novices who had performed fewer than 20 laparoscopic gastrectomies (Table 1).
Analysis Video
All laparoscopic distal gastrectomy videos were taken between 2019 and 2022, and a total of 18 videos were evaluated, three from each surgeon. Members of the expert group selected three videos of their most recent cases during the study period, and members of the novice group selected three videos of their first cases in their careers. Videos were recorded at 30 fps, HD quality, using a 3D curved tip videoscope (LTF-S300-10-3D, Olympus, Tokyo, Japan) and a 3D video processor (VISERA ELITE II OTV-S300, Olympus, Tokyo, Japan). As surgeons from a single institution participated, the surgical procedures were standardized and constant: omental part dissection, transverse mesocolon removal, subpyloric lymph node dissection, right gastroepiploic vessel dissection, and duodenal vessel dissection on the greater curvature side.
AI Development
The analysis was performed using a proprietary AI algorithm developed by Anaut Inc. (Tokyo) based on DeepLab v2 developed by Google LLC. As a training dataset, 1,080 still images were extracted from the surgical videos of 6 cases other than the 18 cases to be evaluated. Ultrasonic coagulation scissors (HARMONIC HD1000i, Johnson & Johnson, New Jersey, USA) were used in all surgeries, and a model was trained by annotating the active blade tip, active blade, and tissue pad of the HARMONIC scissors (Figure 1a), and analysis was performed using the trained model.

(One) Annotated image. The active blade tip, active blade, and tissue pad of the HARMONIC scissors are annotated. (b) Screenshot from AI surgical video analytics showing color coding of HARMONIC scissors. The active blade is blue, the tissue pad is green, and the tip of the active blade is color coded with a purple circle to retain an afterimage of the past 10 frames. The top left of the screen shows the X and Y coordinates of the tip, as well as velocity, acceleration, and jerk.
Video Analysis
In the AI analysis of the surgical video, the active blade was colored blue, the tissue pad was colored green, and the tip of the active blade was colored with a purple circle to leave an afterimage of the past 10 frames. The X and Y coordinates of the tip, velocity, acceleration, and jerk are displayed in the upper left corner of the screen (Fig. 1b). A portion of the video is available in Online Resource 1.
Evaluation accuracy
For the test dataset for accuracy evaluation, we divided each video into 11 parts of equal length and extracted the second and subsequent images from the top. For example, for a video with 11,000 frames, we extracted 10 images from frame number-001 (e.g., 1001, 2001, 3001, …, 10,001). Since we extracted 10 images per case, there were a total of 180 images for accuracy evaluation.
Accuracy was evaluated using true positive rate (TPR), false positive rate (FPR), and DICE. DICE and TPR are the most commonly used metrics for machine learning performance evaluation.18.
Fluctuation Analysis
When β is close to 1 in the time series power spectral density S(f) of the following equation, it is said to have 1/f fluctuations.
$$S(f)\propto \frac{1}{{f}^{\beta}}$$
Taking the logarithm of both sides, the slope of the fitted line plotted on a logarithmic scale is β. β = 0 is called white noise and represents a chaotic situation. β = 1 is a 1/f fluctuation, and as β approaches 2, the movement becomes more regular.19.
$$logS(f)\propto log(\frac{1}{{f}^{\beta }})=-\beta logf$$
Movement characteristics were calculated by frequency analysis of the time series data of the movement distance. Using Python Ver. 3.9, the time series data was divided into 3-second intervals, and the power spectrum was calculated by fast Fourier transform and plotted on a logarithmic scale. Fluctuations were analyzed by drawing an approximate line using the least squares method and evaluating the slope β.
Code Availability
A portion of the data and the code to calculate the slope β can be found in Online Resources 2, 3.
Statistical analysis
The total number of frames and the number of frames in which the surgical scissors were visible were calculated. From the videos, the on-screen X and Y coordinates of the scissors tips were calculated, followed by the kinematic indices of distance traveled, velocity, acceleration, jerk, and variability index β. R (R Foundation for Statistical Computing, Vienna, Austria, version 4.1.0) was used for statistical evaluation. Statistical post-hoc power was calculated using G*Power 3.1.9.7.20.
A density plot was used to evaluate the distance traveled per second. This plot represents the shape of the data distribution as a curve based on kernel density estimation, which represents the distribution more smoothly than a histogram. The area between the curve and the x-axis was equal to 1 in both groups, adjusting for the difference in operative time between the two groups.
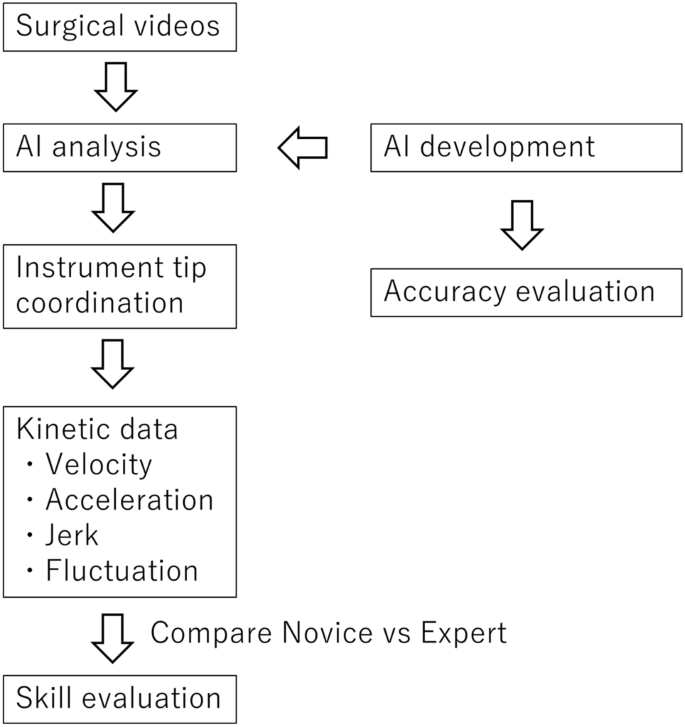
The primary outcome of this study is to identify indicators that differ according to skill level, and the secondary outcome is to identify cut-off values for those indicators. The design of this study is shown in Figure 2.