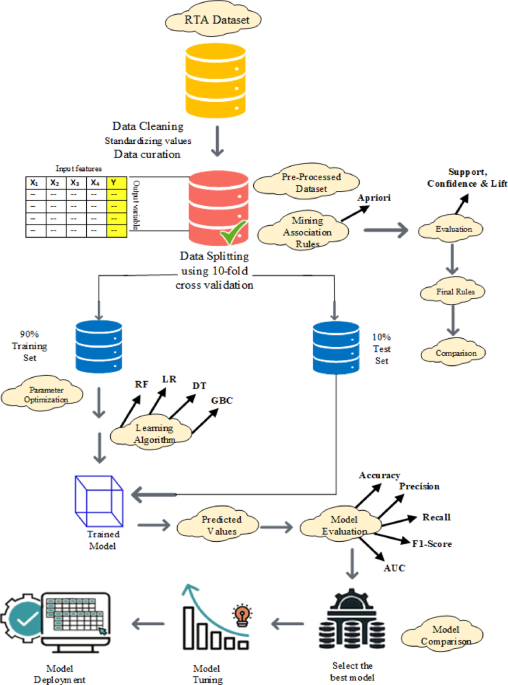
Asm we have obtained considerable knowledge about the data and can easily build models. To find an appropriate ML model for our proposed system, this study conducts two experiments on datasets using the sklearn and keras libraries of python. sklearn and keras are Python libraries that are used to train ML and Deep learning models, on the other hand apyori is a python library that utilizes the apriori algorithm and finds the associations. In this section, we investigate the following research question:
Question 1: Which machine learning or deep learning model provides the best trade-off between accuracy and computational efficiency for injury classification.
To address the above research question (i.e., Question 1) a combination of Deep Learning (DL) and Machine Learning (ML) models has been employed on KSI dataset.
To explore the current study research question, we check the performance of different deep Learning and Machine learning models that are Random Forest, SVM, XGBoost, BiLSTM, ATTR-LSTM, KNN-LSTM, and W-CNN-LSTM on KSI dataset using their default and hyperparameters. The current study select these models because their performance is good on both numeric and categorical data. Random Forest & XGBoost are ensemble-based models and handle any mix data type, furthermore it can handle model overfitting problems32,33. Support Vector Machine (SVM) performance is good on high -dimensional data, it used decision boundary concept during classification task34, The current study used Deep Learning Models (BiLSTM, ATTR-LSTM, KNN-LSTM, W-CNN-LSTM) because it suitable for sequential nature of our dataset. The LSTMS model is famous for capturing dependencies and contextual relationships between data35 (W-CNN-LSTM is a new version of the LSTM model which increases the accuracy and improves feature extraction through convolutional features. The current study combines both traditional ML and Deep learning models to ensure the effective analysis of injury severity classification.
To highlight the strength and weaknesses of every classification model the confusion matrices have been used as shown in Figs. 8, 9, 10, 11, 12, 13 and 14. The KSI dataset is used for classifying the injury severity.

Confusion matrix of random forest model on KSI dataset.

Class wise performance of random forest model on KSI dataset.
First, we trained Random Forest (RF) on default parameters (n_estimators = 100, random_state = 42) on KSI dataset. The Fig. 8, show that true positive rate of Random Forest on no Injury = 0.8889 (88.89%), Fatal = 0.8351 (83.51%), Major = 0.8211 (82.11%), Minor = 0.4357 (43.57%), Minimal = 0.1274 (12.74%). The result shows that the model performs well in identifying No Injury (88.89%) and Fatal cases (83.51%). The performance of RF models across different classes shown in Fig. 9.
Major injuries (82.11%) are also classified relatively well, but the result shows that the model struggles with Minor (43.57%) and Minimal injuries (12.74%), likely due to class imbalance or overlapping features.

Confusion matrix of SVM developed over KSI dataset.

Class wise performance of SVM model on KSI dataset.
In the second phase, we trained SVM on default parameters (kernel=’rbf’, probability = True) on KSI dataset. The Fig. 10 show that True positive rate of SVM on no Injury = 0.7814(78.14%), Fatal = 0.7993 (79.93%) ,Major = 0.8062 (80.62%),Minor = 0.4660 (46.60%),Minimal = 0.0352 (3.52%). The Result shows that the SVM model performs well in identifying No Injury, Fatal, and Major cases. Moreover, class wise performance of the SVM model on KSI dataset shown in Fig. 11.
The SVM model struggles with Struggles with Minor (46.60%) and Minimal (3.52%) cases, indicating possible class imbalance or feature overlap.

Confusion matrix of XGBoost on KSI dataset.

Class wise performance of XGBoost model on KSI dataset.
Third, we trained XGBoost on default parameters (use_label_encoder = False, eval_metric=’mlogloss’) on KSI dataset.True positive rate of XGBoost on no Injury = 0.8695 (86.95%), Fatal = 0.8459 (84.59%), Major = 0.8411 (84.11%),Minor = 0.4471 (44.71%), Minimal = 0.1572 (15.72%). The Fig. 12 shows that the XGBoost model performs well in identifying No Injury, Fatal, and Major. The class wise performance of XGBoost model presented in Fig. 13.
The XGBoost model struggles with Minor (44.71%) and Minimal (15.72%) cases, similar to SVM, but slightly better than SVM for Minimal cases.

Confusion matrix of BiLSTM developed over KSI dataset.

Class wise performance of BiLSTM model on KSI dataset.
Fourth, we trained BiLSTM on parameters (activation=’relu’,‘softmax’, dropout (0.3) on KSI dataset. True positive rate of BiLSTM on no Injury = 0.8830 (88.30%), Fatal = 0.7239 (72.39%), Major = 0.7350 (73.50%), Minor = 0.2977 (29.77%), Minimal = 0.00%. The Fig. 14 that BiLSTM model performs well in identifying “No Injury” (88.30%) but drops significantly for “Minimal” (0.00%) cases. Major and Fatal categories are classified moderately well (73.50% and 72.39%) but are lower compared to XGBoost. The BiLSTM model struggles with Minor injuries (29.77%). Figure 15 shows performance of BiLSTM across different classes.

Confusion matrix of ATTR-LSTM developed over KSI dataset.

Class wise performance of ATTR-LSTM model on KSI dataset.
Then we trained ATTR-LSTM on parameters (activation=’softmax’, flatten layer, return_sequences = False) on KSI dataset. The Fig. 16 show that True positive rate of ATTR-LSTM on no Injury = 0.7997 (79.97%), Fatal = 0.7741 (77.41%), Major = 0.7558 (75.58%), Minor = 0.4168 (41.68%), Minimal = 0.0835 (8.35%). The Result shows that the ATTR-LSTM performs better than BiLSTM in most categories.“No Injury” classification is slightly lower than BiLSTM (79.97% vs. 88.30%).“Fatal” and “Major” TPRs are higher than BiLSTM (77.41% vs. 72.39% and 75.58% vs. 73.50%).“Minimal injury detection is slightly better than BiLSTM (8.35% vs. 0.00%) but still very low. “Minor” class also improved (41.68% vs. 29.77%). Figure 17 shows performance of ATTR-LSTM across different classes on KSI dataset.

Confusion matrix of KNN-LSTM developed over KSI dataset.

Class wise performance of KNN-LSTM model on KSI dataset.
Then we trained KNN-LSTM on parameters (activation=’softmax’, ‘relu’, flatten layer, return_sequences = False) on KSI dataset. True positive rate of KNN-LSTM on no Injury = 0.7431 (74.31%), Fatal = 0.9140 (91.40%)), Major = 0.8263 (82.63%), Minor = 0.4242 (42.42%), Minimal = 0.0325 (3.25%).
The Result in Fig. 18 shows that KNN-LSTM achieves highest accuracy for Fatal cases (91.40%) and Major cases (82.63%) and No Injury class performance is slightly lower than ATTR-LSTM (74.31% vs. 79.97%). Minimal class has a very low recall (3.25%), similar to other models. Minor class TPR (42.42%) is slightly better than ATTR-LSTM (41.68%). Moreover, the class-wise performance of KNN-LSTM shown in Fig. 19.

Confusion matrix of W-CNN-LSTM developed over KSI dataset.

Class wise performance of W-CNN-LSTM model on KSI dataset.
Finally, we trained W-CNN-LSTM on parameters (n_estimators = 100, random_state = 42) on KSI dataset. True positive rate of W-CNN-LSTM on no Injury = 0.7655 (76.55%), Fatal = 0.7741 (77.41%), Major = 0.8147 (81.47%), Minor = 0.4009 (40.09%), Minimal = 0.1545 (15.45%).
The Result in Fig. 20 shows that W-CNN-LSTM achieves the highest accuracy No Injury (76.55%) and Major (81.47%) on KSI dataset. The fatal class has a lower TPR (77.41%) compared to KNN-LSTM (91.40%) on KSI dataset. Minimal class has a better recall (15.45%) compared to KNN-LSTM (3.25%) but still needs improvement. Minor class performance is weaker (40.09%) than KNN-LSTM (42.42%). Figure 21 Class wise Performance of W-CNN-LSTM Model on KSI Dataset.
The BiLSTM shows higher performance in identifying “No Injury” and Major Injuries however, BiLSTM leads to frequent misclassification in distinguishing Minimal and Minor injury categories.The ATTR-LSTM comparatively performs better than BiLSTM for the identity of Major injuries and leading higher misclassification in Minor and Minimal injuries. KNN-LSTM performs well for Major and Fatal categories of injuries while shows poor performance in classifying Minimal and Minor injuries. W-CNN-LSTM demonstrates balanced results regarding most of the injury categories with good accuracy. However, results in misclassification for Minor category of injuries. The Random Forest (RF) classification algorithm shows better performance for dominant classes and lower performance for categories with lower frequency i.e., class imbalance remains a challenge for RF models. The traditional models like SVM show poor performance as compared to Deep Learning (DL) models. This is because these models lack the capability to effectively handle sequential dependency. In summary, as compared to the traditional models, the DL models especially the W-CNN-LSTM shows better performance due to their hierarchical extraction of features. However, there is still a need to enhance the capability of DL models for refined feature representation and to address class imbalance issues.
The evaluation of various machine learning (ML) and deep learning models on injury severity classification reveals distinct performance trends (as shown in Table 6). Among traditional ML models, XGBoost (accuracy: 0.7497, F1-score: 0.73) and Random Forest (accuracy: 0.7449, F1-score: 0.72) emerged as the top-performing models on KSI dataset., demonstrating strong predictive capabilities. These models effectively handle categorical and numerical data, leveraging ensemble learning techniques to enhance classification performance32,33.
On the other hand, deep learning models, including BiLSTM, ATTR-LSTM, KNN-LSTM, and W-CNN-LSTM, exhibited moderate accuracy ranging from 0.6711 to 0.6998 on KSI dataset. While these models have the advantage of capturing sequential patterns in data, their performance was slightly lower than XGBoost and Random Forest, possibly due to the dataset’s complexity and size. Among deep learning models, BiLSTM and W-CNN-LSTM performed slightly better, suggesting that CNN-based feature extraction and bidirectional learning improve model effectiveness. Support Vector Machines (SVM) demonstrated the lowest accuracy (0.6815) on KSI dataset. among traditional ML approaches, indicating that linear decision boundaries may not be optimal for this dataset. However, SVM still showed competitive precision and recall values, implying its potential effectiveness with additional feature engineering.
Overall, XGBoost and Random Forest emerged as the most reliable models, offering a balance between precision, recall, and F1-score. While deep learning models show promise, further optimization, larger datasets, or feature extraction techniques could enhance their predictive power. Deep learning models like KNN-LSTM, W-CNN-LSTM, BiLSTM, and ATTR-LSTM has shown competitive AUC values (ranging from 0.93 to 0.91) demonstrating their potential for complex pattern capturing. However, their performance can be improved further by adding more data.
The comparison results shown in Fig. 15 reveals that the XGBoost outperform in terms of ROC curve against their counterparts. The XGBoost, RF, and BiLSTM achieved 0.95, 0.94, and 0.93 on KSI dataset for AUC respectively. These results show that XGBoost and RF can be considered as the most favorite classifiers for the mentioned dataset.
Due to the limited temporal coverage, the KSI dataset leads to major challenges in applications of DL models, specifically in terms of generalization and model training. Because DL models need large data and memory to effectively capture the underlying patterns. Research studies show that due to inadequate coverage of phenomena, small datasets result in model overfitting which degrades the performance of DL models as it memorizes the training data instead of generalizing it36. Moreover, due to the limited scope of temporal data, the adaptability of DL models to the changes over time which is highly important for most of the real-world applications37. Therefore, development of robust and reliable models on KSI dataset could become a challenge of DL models.

Learning curves of KNN-LSTM.
Figure 22 left graph shows the accuracy curve for both training and validation accuracy across 20 epochs. The accuracy indicates a steady improvement during the initial epochs, with both training and validation accuracy increasing from approximately 0.45 to above 0.65 by the tenth epoch. The training and validation accuracy rise steadily together, which indicates that the model has learned useful patterns without overfitting in the early stage. Furthermore, validation accuracy quickly jumps closer to the training accuracy by epoch 5. The right graph shows a loss curve which demonstrates a similar trend, with training and validation loss decreasing in the early epochs consistently, followed by slow convergence after epoch 10. While training loss continues to decline to approximately 0.75, validation loss stabilizes around 0.78–0.80, suggesting mild overfitting. Overall, the results show that the KNN-LSTM model converges effectively, achieves stable performance, and demonstrates reasonable generalization ability. Both curves gradually converge, with training accuracy stabilizing around 0.71–0.72 and validation accuracy around 0.68–0.69.

Learning curves of ATT-LSTM.
Figure 23, ATTR-LSTM achieved higher validation accuracy, but its performance plateaued around epoch 10 (~ 0.66–0.67), whereas training accuracy continued to improve to ~ 0.72. Similarly, validation loss in ATTR-LSTM is static and even fluctuated upward.

Learning curves of BiLSTM.
Figure 24, BiLSTM exhibited consistent learning behavior with strong generalization performance across training and validation sets. The accuracy curve with training accuracy reaching approximately 0.72 and validation accuracy closely following at around 0.70, indicating minimal divergence. Similarly, the loss curve demonstrated smooth convergence, with both training and validation loss.

Learning curves of W-CNN-LSTM.
Figure 25, W-CNN-LSTM has trained for 20 epochs where the training accuracy increases smoothly from ~ 0.54 → ~0.70; validation accuracy increases from ~ 0.60 → ~0.69. Similarly, training loss declines steadily from ~ 1.08 → ~0.79; validation loss declines from ~ 0.98 → ~0.83 indicating the model is learning from the training data.

ROC curve of top performing ML models trained over KSI dataset.
The W-CNN-LSTM, ATTR-LSTM, and SVM have shown comparable performance on KSI dataset by obtaining an AUC of 0.91 (as shown in Fig. 26). However, the ensembled based models like RF and XGBoost showed slightly better performance. These results reveal that ensemble Learning models are more reliable for handling structured datasets and with categorical attributes.
To explore the answer of research question 1, In this study, XGBoost and Random Forest achieved high accuracy in classified injury types. XGBoost demonstrated strong performance with accuracy (0.75) and an AUC of 0.75 values because these models are well suited for structure and categorical data. Similarly, Random Forest received accuracy of 0.74 and higher AUC of 0.94 which is near to previous models. Additionally, these models have lower computation times as compared to deep learning models.
The BiLSTM achieved good performance (accuracy: 0.70, AUC: 0.93) compared to other deep learning models on the KSI dataset. This finding indicates that BiLSTM effectively captures complex temporal patterns. On the other side, ATTR-LSTM, KNN-LSTM, and W-CNN-LSTM show low performance in predicting injury type with accuracy ranging from 0.67 to 0.68 and AUC values 0.91 to 0.92. These results recommend that ensemble- based model XGBoost and Random Forest are promising choices to address this problem.
After training and testing Machine learning and deep learning models with default configuration, hyperparameter tuning is performed to enhance the performance of the trained models. For this purpose, a Grid search method has been used which evaluates multiple combinations of hyperparameters in a systematic way. The aim of using the Grid search method is to identify the best combination of hyperparameters that provide higher performance on the validation of datasets. To ensure robustness and reduce overfitting, a 2-fold cross validation with seed = 42 has been used. The experimental setup for hyperparameter tuning shown in Table 5.
The performance of trained models with default parameters has been compared with the hyperparameter tuned performance of these models (as shown in Table 7).
The hyperparameter tuning results show that the performance of the Random Forest (RF) model substantially improved for accuracy, and F1-score as compared to SVM and XGBoost. The RF model has obtained 0.9963, 0.9942, and 0.9963 accuracy, F1-macro, and F1-micro respectively. This highlights the capability of RF to effectively handle class imbalance and to capture complex features interactions. The XGBoost demonstrates moderate improvement for hyperparameter tuning as compared to the default parameters in terms of accuracy and F-1 micro score. However, obtained a lower F-1 macro score which advocates that the XGBoost model faces difficulty in balancing minority class predictions. Similarly, SVM has shown drastic decline in the performance for all the three parameters which reveals their limitations in handling feature distribution of datasets and sensitivity to hyperparameter tuning.
On the other hand, the hyperparameter tuning results show that the performance of deep learning models like BiLSTM, ATTR-LSTM, KNN-LSTM, and W-CNN-LSTM has decreased after tuning. This decrease in the performance can be associated with limited training epochs, shallow hyperparameter configurations, and small dataset size that restrained their capability to learn complex representations.
The findings of hyperparameter tuning suggests the effectiveness and reliability of the machine learning models like RF and XGBoost for structured accident data. Moreover, to achieve competitive performance for deep learning models, there is need for extended training, larger datasets, and more advanced tuning strategies.
Question 2: What are the underlying hidden factors that contribute to fatal or major injuries?
To answer the second research question and identify patterns of factors, a second experiment was conducted using association rule mining (ARM). This analysis was performed on both the KSI and RATA dataset. This experiment utilized Python and apriori algorithms and 128 rules were extracted but 6 rules were important in KSI dataset and 4 rules were important in RTA dataset (as shown in Fig. 27) which is described below:
Rule 1: indicates a strong association between accidents involving pedestrians and the absence of red-light violations on weekends. The higher lift value shows a stronger association between antecedent and consequence, and the confidence value shows that there are 97% chances of pedestrian collisions on weekends with no red-light violation. The support, confidence, and lift on the subgroup nature of accident are mentioned in Table 8.
Rule 2: suggests a strong association between speeding and aggressive driving. The support indicates that this pattern is present in 12% of the dataset. The confidence value shows that when there is speeding, there is an 85% likelihood of aggressive driving. The higher lift value suggests that the occurrence of aggressive driving is 2.42 times more likely when speeding is observed, compared to when these events are independent.
Rule 3: indicates that aggressive driving is the reason for 70% of rear-end collisions regardless of the red-light violations, and these collisions lead to non-fatal accidents. The higher lift value shows a stronger association between these attributes.
Rule 4: indicates red light violations are associated with the absence of over speeding, coupled with aggressive driving that leads to non-fatal injuries. The support shows that this pattern occurs in 6.2% of the dataset. The confidence value suggests that when there is a red-light violation, there is a 73.3% likelihood of observing no over speeding and aggressive driving.
Rule 5: shows a mild association between accidents involving pedestrians with the injury severity as none. The rule also states that about 95% of such collisions exist in the dataset with no over speeding from the vehicle involved.
Rule 6: shows that the Slow-Moving Vehicle (SMV) collisions lead to non-fatal injuries. The confidence value shows that about 82% of collisions are of this nature, furthermore, these collisions do not break the red-light violation.
The same association rule mining approach was applied to the RTA dataset during covid-19 period.
Rule 1: within the ‘Nature of Accident’ over RTA dataset shows an association between over speeding during a time window of 12–18 h (12:00 PM to 6:00 PM) and minor, non-fatal accidents. The confidence value 0.57 suggests that 57% of accidents involving over speeding, in this time range, were classified as minor and non-fatal.
Rule 2: highlights a strong association between careless driving behavior and single fractures with non-fatal outcomes. The very high confidence of 0.99 indicates that in nearly all the accidents involving carelessness and result the consequence being a single fracture and non-fatal.
Rule 3: within ‘Nature of Accident and External Factors’ category over RTA dataset shows a strong association between accidents occurring during the night hours (18 to 24:00) or (6:00 PM to 12:00 AM) and the outcome being a single fracture. The confidence value of 0.1 shows that, in the dataset, all accidents recorded under these conditions were associated with single fractures.
Rule 4: shows that the injury severity of minor, non-fatal accidents are more common during rainy days between 12 PM and 6 PM. The confidence value of 0.78 shows that when accidents happen during the specified time range on rainy days, there is a 78% chance of minor and non-fatal injuries.
The rule 1 within ‘Nature of Accident and Vehicle Factors’ over RTA dataset shows strong association between over speeding on motorcycles during weekends and minor injury severity. The rule 2 shows association between over speeding in cars and rickshaws results in non-fatal and minor injuries. The confidence value of 0.64 and 0.71 of rule 2 shows that 64% and 71% chances of non-fatal and minor injuries respectively. The support, confidence and lift on the subgroup nature of accident are mentioned in Table 9:
The RTA dataset corresponds to the COVID-19 pandemic period and reflects road usage during this time. The results show that the overall traffic volume during weekends is low however, vehicle speed is high. Moreover, motorcycle usage and increased speeds due to limited public transport on weekends results in a higher number of motorcycle accidents. These findings suggest the implementation of stricter government policy on speed regulation during low-traffic periods and highlights the importance of targeted interventions for high-risk groups. Furthermore, such policies should remain flexible to allow timely adjustments during crisis situations.
The current study examines traffic characteristics and accident trends in Pakistan and Canada, highlighting the needs for country specific interventions that accounts for differences in traffic behaviors and road infrastructure. In Canada, well developed infrastructure contributes to lower reliance on motorcycles while Pakistan faces more challenges due to high motorcycle usage. To address these challenges, both countries need to implement effective road safety policies. Based on the association rule mining results from the KSI (Canada) and RTA (Pakistan) datasets, several key recommendations can be made to improve road safety in both countries. In Canada, pedestrian safety can be enhanced by implementing stricter measures against aggressive driving and red-light violations, especially on weekends. Additionally, installing traffic control measures on Mid-Block roads in high-risk areas like District Etobicoke York could significantly reduce accidents. In Pakistan, over-speeding, particularly on motorcycles during weekends, is a major cause of minor but frequent accidents. Enforcing speed limits and increasing awareness about safe driving behaviors during peak accident hours (12 PM – 6 PM) can help mitigate risks. Moreover, improved road lighting and traffic signals at high-risk intersections could reduce the severity of nighttime accidents. Both countries should focus on targeted interventions, such as stricter enforcement of traffic laws, public awareness campaigns, and infrastructure improvements, to address their unique accident patterns effectively.

Top association rules of KSI and RTA datasets.


