Study design and setting
This applied retrospective predictive modeling study was conducted in 2024 using historical data of cardiovascular inpatients admitted to a specialized cardiovascular clinic of a tertiary teaching hospital in Tehran between 2022 and 2023. The hospital was one of Iran’s largest specialized teaching and tertiary cardiovascular centers. In addition to model development, this research also includes the implementation of a real-time clinical decision support system designed for use within hospitals.
Identifying variables
An initial set of candidate variables was identified through a systematic review focusing on factors associated with length of stay (LOS) and treatment costs in patients with cardiovascular disease. In this review, we synthesized existing evidence on clinically relevant and frequently reported predictors. A focus group session with seven experts, including two health economics experts, two health care management experts, one health information technology expert, one cardiologist, and one bioinformatician, was then conducted to align the findings with data available in the hospital information system (HIS). Variables supported by the literature and accessible in the HIS were selected for model development.
Extract and incorporate data
The data is extracted from HIS in CSV format and consists of 16,770 rows and 14 variables. Each row corresponded to an anonymized inpatient case. Extracted variables included age, gender, marital status, insurance type, length of stay (LOS), diagnosis, intervention type (angioplasty or CABG, based on ICD-9-CM), major comorbidities (based on ICD-10), discharge status, admission and discharge dates, and cost-related variables (total costs, insurance company payments, and patient OOP). The dataset included adult cardiovascular inpatients (18 years and older) who underwent angioplasty or CABG during the study period.
Data preprocessing and cleaning
A 3-hour focus group session was held with seven experts, including two health economics experts, two health care management experts, one health information technology expert, one cardiologist, and one bioinformatician to review the dataset and finalize feature selection. Duplicate entries and outliers were removed. No missing values were observed in the dataset. Figure 1 provides an overview of the patient selection and cleaning process. Categorical variables (e.g., intervention type) were transformed using one-hot encoding, and numerical features were standardized using min-max scaling (range 0–1). Cost-related variables were excluded from the LOS model because the primary objective was to predict LOS before admission. This decision was guided by preliminary correlation matrix analysis, which revealed a strong positive relationship between LOS and all cost-related variables. These features were excluded from the LOS model to avoid multicollinearity. In our clinical practice, for most elective cardiovascular cases, the type of intervention (angioplasty or CABG) is usually decided before admission. Therefore, this was considered a prehospital variable for predicting LOS. The cleaned dataset was randomly split into a training (80%) set and a testing (20%) set.
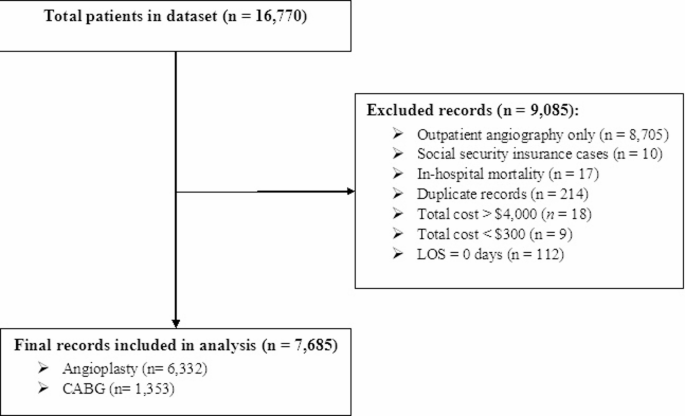
Flowchart of patient inclusion and exclusion criteria.
Feature selection
To improve model performance and reduce dimensionality, feature selection was performed in two stages. First, we performed a correlation matrix analysis to identify highly correlated variables and minimize multicollinearity. This step ensured that only relevant, non-redundant features were retained. Shapley Additive Explains (SHAP) was then applied to the XGBoost model to assess the individual contribution of each feature to the predictions. SHAP provided both global and local interpretability and helped identify the variables that most influenced model performance. Feature importance plots based on SHAP values were used to support decision making in the final selection of features.
Machine learning regression method
We compared eight regression models on the prediction task to identify the most effective algorithm. Random Forest Regression, Gradient Boosting Regression, LightGBM, Decision Tree Regression, Support Vector Regression (SVR), K-Nearest Neighbors (KNN), Artificial Neural Networks (ANN), and Extreme Gradient Boosting (XGBoost). Separate models were trained for each objective outcome (LOS, total cost, patient OOP, and insurer payment) to optimize predictive accuracy for each objective. To justify model selection, preliminary exploratory analyzes were conducted to assess the underlying data structure and the relationships between predictor variables and outcomes. These analyzes revealed substantial nonlinearity, skewness, and overdispersion of the LOS and cost variables, as well as complex interactions between the predictor variables. Due to these characteristics, traditional linear models and generalized linear models (including linear regression, Poisson regression, and gamma regression) showed poor fit in initial trials and were not suitable for capturing the nonlinear patterns present in the dataset. Therefore, the eight machine learning algorithms included in this study were selected for their ability to model nonlinear relationships and complex feature interactions without relying on strict distributional assumptions.
SHAP analysis
To increase interpretability, SHapley Additive exPlanations (SHAP) was applied to the best performing models. SHAP is a game-theoretic approach based on Shapley values that quantifies the contribution of each feature to a particular prediction by evaluating all possible combinations of features. In this framework, SHAP decomposes single-instance predictions into additional contributions from each input feature, allowing for both global and local model interpretability. Global interpretability is achieved by aggregating SHAP values across all samples to identify the most influential predictors. On the other hand, local interpretability allows us to explore how each feature drives predictions for individual patients. This dual-level description supports transparency, facilitates clinical validation, and increases confidence in model output.
XGBoost algorithm
In this study, Extreme Gradient Boosting (XGBoost) was used as one of the core algorithms and demonstrated the best predictive performance across all outcomes. XGBoost is an optimized implementation of gradient boosting that sequentially builds an ensemble of decision trees, where each new tree learns to correct the residual errors of the previous trees. This algorithm minimizes a normalized objective function that includes both training loss and complexity penalties, mitigating overfitting. Key benefits include parallel tree construction, reduction (learning rate), column sampling, and quadratic gradient optimization. The simplified pseudocode runs XGBoost repeatedly.1 Compute the gradient and Hessian for each instance.2 Build a tree structure by selecting the optimal split point based on the gain.3 Update the leaf weights to minimize the objective. and4 Aggregate the tree into the final model. These properties allow XGBoost to effectively capture complex nonlinear relationships within clinical datasets.
Model evaluation and validation
Model training included hyperparameter tuning using GridSearchCV, which was 10-fold cross-validated on the training dataset. The best performing models in this phase were further evaluated using an additional 10-fold cross-validation to assess robustness and prevent overfitting. Final performance metrics were calculated on an independent 20% test set using standard regression metrics with R.2 Score (coefficient of determination), mean absolute error (MAE), mean squared error (MSE), and root mean squared error (RMSE). This two-layered approach ensured reliable and generalizable model evaluation.
Statistical analysis and tools
All analyzes were performed using Python version 3.12.7. Scikit-learn (v1.6.1) and XGBoost (v3.0.0) were used for model training and evaluation, and SHAP was used for model explainability. Additional libraries such as Pandas (v2.2.3), NumPy (v2.1.0), Matplotlib (v3.10.1), and Seaborn (v0.13.2) supported data processing and visualization. All calculations were performed on a workstation equipped with an Intel Core i7-13700 K CPU, 32 GB RAM, and NVIDIA RTX 4060 GPU.
Application implementation
To transform the predictive model into a practical tool, both a web-based application and a desktop version for predicting LOS and treatment costs (including patient, insurance, and total costs) were developed. The application allows users to enter patient information such as age, gender, insurance type, LOS, intervention type, and comorbidities. Next, use the trained XGBoost model to compute real-time predictions. This web application was implemented using Python and the Streamlit framework and is currently being deployed in a hospital environment to assist clinicians with discharge planning and resource allocation.
ethical considerations
This study was approved by the Research Ethics Committee of Baqiyatallah University of Medical Sciences (IR.BMSU.BAQ.RE.1403.017). Informed consent was obtained from all subjects and/or their legal guardians. All methods were performed in accordance with relevant guidelines and regulations.