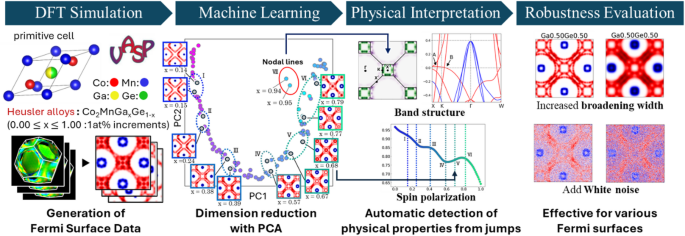
Machine learning analysis of fermi surface morphology and spin polarization

Fermi Surface Images Obtained from First-Principles Calculations.
The upper panel displays the plot data exported from FermiSurfer, while the lower panel shows the corresponding blurred Fermi surface images mimicking ARPES experimental data.
Figure 2 presents representative Fermi surface images obtained from our DFT calculations. In these images, the up-spin bands are rendered in red while the down-spin bands appear in blue; dashed lines delineate the Brillouin zone boundaries. These features are consistent with the ARPES images reported by Takashi Kono et al.39, thereby validating our computational approach (Figure S2). Notably, for Co₂MnGe (i.e., at X = 0), only the red up-spin Fermi surface is observed, resulting in a high spin polarization. In contrast, as the Ga content increases, additional blue down-spin features emerge at the fourfold Γ points. The expanding down-spin contributions near the Γ point lead to an overall reduction in spin polarization, while the morphology of the up-spin bands near the X and K points also varies with composition, yielding a complex evolution of the spin polarization. To quantitatively interpret these nontrivial changes, we employed principal component analysis (PCA) for machine learning on the Fermi surface images.

Dimensionality Reduction of Fermi Surfaces via PCA.
The two-dimensional PCA mapping is shown, where the horizontal axis represents PC1 and the vertical axis represents PC2. Each plotted point corresponds to compositions, and the color indicates spin polarization. Representative Fermi surface images are displayed around the plot. There are several “jumps” in a continuous trend. I-VI jumps correspond to extrema and inflection points in the spin polarization, and largest VII jumps occurring in the compositions where the nodal lines appear on the Fermi surface.
PCA was applied to the Fermi surface image dataset, and the data were projected onto a two-dimensional space, as shown in Fig. 3 and Figure S3. Each point in the plot corresponds to the Fermi surface data of a specific composition. The first principal component (PC1) and the second principal component (PC2) account for 64.7% and 16.1% of the total variance, respectively, with a cumulative contribution of 80.8% when combined (Figure S4). This high retention of information in two dimensions underscores the effectiveness of the dimensionality reduction. Moreover, PC1 shows a strong correlation with the Ga/Ge composition (correlation coefficient of 0.966), suggesting that it robustly captures the compositional influence on the Fermi energy of CMGG (Figure S5, S6).

Correlation Between Spin Polarization and Electronic Structure.
(a) Variation in spin polarization for Co₂MnGaₓGe1−x is presented, with the horizontal axis indicating the compositional ratio and the vertical axis representing the spin polarization values. Vertical line indicate the “jumps” of PCA mapping, which is accord to extrema and inflection point. (b, c) The calculated band dispersion of Co₂MnGe and Co₂MnGa is shown, with markers A and B denoting nodal lines. (d) Fermi surface images of the compositions (Ga = 0.94 and 0.95) which show largest “jumps” and their differential images are presented. Highlighted regions of differential images are consistent to the nodal lines.
In the PC2 direction, several pronounced “jumps” are observed (Figure S5, S6). Since the Euclidean distance between points in the PCA space reflects the similarity of the input images, large jumps indicate significant changes in Fermi surface morphology. In Fig. 3, these jumps are labeled I through VI. The compositions corresponding to these jumps match the extrema or inflection points in the spin polarization curve shown in Fig. 4(a). For example, jump I at compositions Ga = 0.14 and 0.15 corresponds to marked morphological changes near the Γ point and aligns with a maximum in spin polarization. Similarly, jump II at Ga = 0.23 and 0.24 corresponds to changes between the Γ and W points, matching a minimum in the spin polarization. Jump V, observed at Ga = 0.67 and 0.68, is associated with the emergence of a band near the X point, which in turn corresponds to an inflection point in the spin polarization. Jumps III through VI similarly coincide with other extrema in spin polarization. These findings indicate that the PCA projection of the Fermi surface morphology provides an effective visual index for tracking variations in spin polarization.
Furthermore, a pronounced deviation is evident at Ga compositions between 0.94 and 0.95 (labeled as outlier VII in Fig. 3, highlighted by a red circle). This deviation corresponds to the appearance of nodal lines, as reported by Kazuki Sumida et al..28 In Co₂MnGa, nodal lines have been observed to emerge slightly above the Fermi energy40, leading to anomalous Hall and Nernst effects29,41,42,43. Figures 4(b) and (c) display the band structures along the X–K–Γ–W path for Co2MnGaxGe1−x with x = 0 and 1.0. These results indicate that compositional changes in CMGG are largely consistent with a rigid band model44,45,46, wherein shifts in the Fermi energy are observed. The points labeled A and B in Figs. 4(b) and (c) correspond to the crossing points between the nodal lines and the high-symmetry Γ-K-X line, with the composition corresponding to outlier VII marking the regime where these nodal lines approach the Fermi level. Figure 4(d) further illustrates the differential Fermi surface images for the extracted compositions; the dark green and purple regions coincide with nodal line A (appearing between the K and X points) and nodal line B (emerging near the K point in the Γ–K segment), which also align with areas of enhanced Berry curvature reported in previous studies.
We interpret these correspondences as follows. Because CMGG is well described within a rigid-band model, the band filling changes continuously with composition (electron count), and PC1 primarily captures the resulting monotonic expansion or contraction of the Fermi surface associated with each band. In contrast, PC2 correlates with changes in Fermi-surface morphology, and its large excursions—“jumps”—can be regarded as signaling pronounced, non-systematic changes of the Fermi surface. The spin polarization is, via Eq. (2), given by the difference in the density of states at the Fermi level, to which the Fermi-surface morphology contributes. Moreover, because PC2 provides a robust representation of the spin-polarization behavior (as discussed below), we interpret switches in spin-polarization trends associated with changes in Fermi-surface morphology as being detected as large jumps along PC2. Similarly, the emergence of a nodal line, which is accompanied by a band crossing and thus a substantial change in Fermi-surface morphology, can manifest as a pronounced jump in the PCA space.
In addition, we compared segmentation based on the “jump” identified by this method with conventional clustering techniques (k-means on a PCA plane). Clustering labels were assigned using known labels: change points (maxima, minima, inflection points) in the spin polarization and the composition at which nodal lines appear. The confusion matrices were then compared. Both methods exhibit regions around cluster 5 that are difficult to partition. However, the partition based on “jumps” successfully isolates the cluster where nodal lines appear. (Figure S7) From these results, it can be said that the proposed method successfully highlighted data (in this paper, composition) exhibiting significant changes in Fermi-surface morphology. Detailed analysis of the composition of interest revealed that the composition is related to the spin polarization changes, the emergence of nodal lines (and their position in momentum space). Therefore, this method demonstrates the ability to extract compositions associated with distinct (anomalous) changes in Fermi-surface morphology that correlate with specific variations in physical properties. This suggests potential applicability to a range of systems, such as strongly correlated materials with flat bands and Weyl/Dirac semimetals with multiple nodal features. At the same time, the core of the approach is the detection of non-systematic anomalies superimposed on systematic trends. In practice, one must carefully assess whether a given material system and dataset satisfy this premise before applying the method.
Robustness evaluation
Experimental ARPES data are often compromised by factors such as limited light source monochromaticity, the performance of electron analyzers, and temperature-induced broadening, which collectively blur the Fermi surface features. Additionally, short measurement times or low absorption cross-sections can lead to significant noise due to low photoelectron counts, thereby degrading the signal-to-noise ratio. Although the simulated maps are only a coarse approximation to full ARPES images, we assessed the applicability of our method under such challenging conditions by evaluating its robustness against broadening and noise additions. Our approach maps the Fermi surface data onto a two-dimensional PCA space and identifies “jumps” — instances where the Euclidean distance between adjacent compositions exceeds a defined threshold. This threshold was established by constructing a histogram of distances between neighboring data points; values in the top 10% of the distribution were classified as significant jumps.

Quantitative Analysis of Fermi Surface Data Under Varying Conditions.
(1) Representative examples of Fermi surface images subjected to different conditions of broadening and noise. (2, 3) Plots of PC2 differences for each composition and their corresponding histograms. (4, 5) PCA mapping and spin polarization plots with compositions exhibiting the top 10% of PC2 differences highlighted. (a) Quantitative analysis results based on the raw Fermi surface data are presented. (b) Analysis results obtained when the broadening width is increased by a factor of 1.5 are shown, demonstrating the method’s performance under degraded resolution. (c) Analysis outcomes with added white noise are provided, confirming the robustness of the PCA-based approach even under high-noise conditions.
Figure 5(a) shows the results of the quantification of “jumps” in the Fermi surface image in the previous section, and Fig. 5(a-1) is representative example of the Fermi surface images. Figure 5(a-2) plots the absolute differences along the PC2 direction as a function of CMGG composition, while Fig. 5(a-3) presents a corresponding histogram with the top 10% of values highlighted in red. Figure 5(a-4) overlays these identified compositions on the PCA map, using red outlines and dashed lines to indicate the critical points. The composition with the largest difference is marked by a red circle and corresponds to the regime where nodal lines appear. Additionally, Fig. 5(a-5) emphasizes that the top 1% of the jumps automatically extract the composition associated with the nodal lines, while the top 10% capture compositions where the spin polarization exhibits marked changes.
Regarding the influence of broadening, our analysis shows that with proper threshold adjustments, similar levels of performance can be achieved (Figure S8, S9). Figure 5(b) demonstrates that even when the Fermi surface images are intentionally blurred to mimic experimental broadening, the data from the Ga-rich side become more pronounced while the extraction of changes on the Ge-rich side becomes more challenging. However, by adjusting the threshold to capture the upper 15% of the distance distribution, we are still able to extract the critical compositions. Even when the broadening width is increased by a factor of 1.5, slight threshold modifications enable the identification of compositions essential for understanding spin polarization. These results suggest that our method remains effective even under conditions of poor momentum resolution or when the bands are not sharply defined due to long fluorescence lifetimes.
When strong white noise (with a PSNR of 4.76 dB) was added to the Fermi surface images, the robustness of the method was further confirmed. As illustrated in Fig. 5(c), although the cumulative variance captured by the PCA decreased in the presence of noise, our approach still successfully identified the compositions associated with variations in spin polarization and the emergence of nodal lines. Our experiments indicate that noise levels exceeding a PSNR of 4.76 dB present significant challenges for analysis (Figure S10). Nonetheless, for materials with low photon absorption cross-sections or in scenarios where measurement time is limited, resulting in low S/N ratios, our method offers a viable pathway for effective analysis.
In summary, these results demonstrate that the PCA-based approach is robust against both broadening and noise effects, and it holds significant promise for facilitating high-throughput ARPES measurements and the automated analysis of complex electronic structures in materials.