

This Methods section contains three subsections: 1) the data simulation process used to generate the synthetic datasets used in this study, 2) the central contribution of the paper: the GATOS workflow used to generate the codebooks for qualitative data analysis, and 3) the evaluation process. We present the methods in this order of data simulation before data analysis (GATOS workflow) because we believe the tradition of data collection (in the form of simulated data here) followed by data analysis might be most familiar to readers.
Data simulation
In this section, we describe how we simulated data for this validation study. The datasets were simulated to mimic the following three contexts that are encountered in social science research settings:
-
1.
Teammate feedback
-
2.
Organizational cultures of ethical behavior
-
3.
Employee perspectives about returning to their offices after the pandemic
These contexts are pertinent to social science research to understand interpersonal teammate dynamics, organizations’ members’ perceptions of the organization’s culture of ethical behavior, and perspectives and attitudes toward workplace location policy shifts.
Our data simulation approach was inspired by common approaches to method development studies in quantitative research, wherein researchers generate synthetic data to test their methods (Morris et al., 2019; Burton et al., 2006). The philosophy is that if we control the data-generating process, then we know what the method should identify as the correct answer. For quantitative methods, that might be the recovery of parameters used to generate the data. For qualitative methods, such as this paper, the analog is recovery of themes or sub-themes used to generate the text data. To be clear, we recognize there are multiple approaches to establishing validation evidence for methods, and we are using synthetic data as one of several approaches in an array of studies.
The objective for generating synthetic data was to generate data that were as realistic as possible, to data that one would encounter in live data collection. The realism here is an important element because even though these synthetic data were generated using LLMs, members of the research team reviewed the generated responses to check whether they sounded like realistic responses we have seen in prior studies. We achieved that objective of generating realistic responses through a multi-step process of first generating backstories and data generation criteria for the text model and then prompting generative text models to simulate data according to those generated criteria. Some criteria were generated by a generative text model while others were researcher-specified. Model-specified criteria included personas, contexts, themes, and sub-themes. Researcher-specified criteria included data type, data collection context, writing style, and writing length. These criteria were important for generating more realistic-sounding synthetic data. The process for data simulation is shown in Fig. 1.
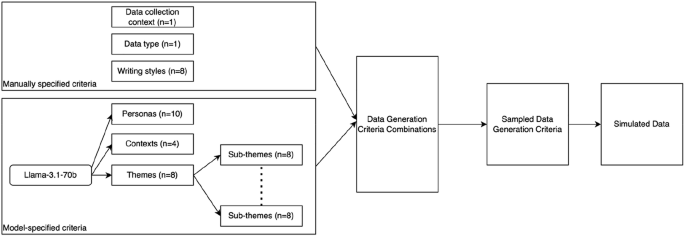
The first step in the data simulation process was to generate personas. We used the open-source Llama3.1-70b generative text model to generate a set of personas each describing attributes of individuals (e.g., age, occupation, personality traits for each) that could be in each study. Then, for each dataset, we used Llama-3.1-70b to generate four imaginary contexts (i.e., situation or environment) based on the overall background that the data were supposed to come from. For example, a context might be “Government Contracting Agency”. Next, using Llama3.1-70b, we generated a list of eight themes that might appear in data for each study as well as eight sub-themes for each theme. We chose eight themes and eight sub-themes per theme to have enough variety without needing to generate too many simulated data points per sub-theme. We also manually specified writing lengths (e.g., short, medium, long) and writing styles (e.g., professional, casual, sentence fragments). Finally, we specified three models that could be used for the data generation process: Wizardlm2-8x22b (Xu et al., 2023), mistral-nemo-12b, and Llama-3.1-8b (Dubey et al., 2024). Each was chosen for its permissive license.
Specifying this combination of models, personas, contexts, writing styles, writing lengths, themes, and sub-themes led to a combinatorially large number of hundreds of thousands of possible simulated data. Rather than generating millions of responses, we randomly sampled 18 possible data points for each sub-theme to generate the actual synthetic datasets used in this study. From a list of 64 sub-themes (8 themes with 8 sub-themes each), this theoretically would result in 1152 data points for each dataset. In practice, this number was smaller due to some overlap in sub-themes and issues with the data simulation process, wherein some models used for data generation did not follow instructions well; these data were discarded. We detected that some models did not follow instructions well in the following way: we instructed the LLM to produce its output in a JSON-structured format. When the format was not followed, then the parsing instructions failed. We then manually inspected those instances, noticed the failure to adhere to the instructions, and discarded those instances. We did not detect any patterns associated with when such failure cases occurred.
The types of data generation criteria used in this process that were generated by a language model are shown in Table 2, and the manually specified data generation criteria are shown in Table 3.
The following subsections describe the data generation criteria and descriptive statistics for the three generated datasets.
Simulated Dataset 1: teammate feedback
The first synthetic dataset came from a hypothetical study of teammate feedback in settings where teamwork is essential. The specified context that the model was given was: “Teammate feedback surveys instructing students to respond to the prompt ‘Please provide constructive comments about your fellow teammates as well as yourself.’ The purpose of these comments is to give you the opportunity to explain how you rated your peers and if there was behavior or experience in particular that influenced you when doing your peer and self-evaluations”.
After removing invalid responses, the simulated teammate feedback dataset consisted of 854 written responses. The average number of words was 194, and the median was 180. The distribution of written response lengths, shown in Fig. 2, demonstrated a bimodal distribution. This distribution was likely due to the way the data were generated by forcing variety in response length through the writing style and writing length criteria.

Distribution of simulated response lengths for teammate feedback. Dashed line: mean (194.24), dotted line: median (180.50).
An example of a simulated response focused on the theme “Conflict Resolution and Negotiation” and sub-theme “Effective Communication Strategies” is the following: “While I appreciated [Teammate’s Name]’s passion for environmental sustainability, their focus sometimes overshadowed the importance of social responsibility in our project. To resolve this, I found it helpful to ask open-ended questions and actively listen to their perspective. However, there were times when I could have been more assertive in expressing my concerns and proposing alternative solutions.” Another example response from the persona of a 25-year-old ambitious graduate student in this synthetic dataset about teammate feedback is given in Supplementary Material S.1.
Simulated Dataset 2: organizational cultures of ethical behavior
The second synthetic dataset is from a hypothetical study of organizational cultures of ethical behavior. The context for this imagined study was: “A study asking people working for large companies the following question: ‘What factors do you believe affect your organization’s culture around ethical behavior?’”
After removing invalid responses, there were 823 responses in this dataset. The average number of words in the responses was 129 and the median was 95. The distribution of the length of those written responses for this scenario, shown in Fig. 3, demonstrated a long-tailed distribution with a few responses being much longer than the rest. This was a deviation from the first dataset’s bimodal distribution.

Distribution of response lengths for faculty perspectives upon returning to work after the pandemic. Dashed line: mean (129.71), dotted line: median (95.00).
An example of a 50-year-old union representative discussing the embedded theme “Communication Channels and Transparency” and sub-theme of “Accessibility of Ethics Resources” response was the following “In my experience, management loves throwing around fancy terms like ‘ethical culture,’ yet they fail miserably when it comes to making ethical guidelines accessible to us on the ground floor. The company’s code of conduct might as well be written in ancient hieroglyphics for all its relevance and readability! It’s buried deep within some obscure intranet site that no one knows about or cares to navigate through.”. An additional example response from the persona of a 32-year-old HR specialist in this synthetic dataset about organizational cultures of ethical behavior is given in Supplementary Material S.2.
Simulated dataset 3: employee perspectives about returning to their workplaces after the pandemic
The third synthetic dataset is from a hypothetical study of employee perspectives about returning to their offices after the COVID-19 pandemic. The specified context for this third study was: “A study or worker perspectives on returning to the office after the pandemic”.
The average number of words in the responses was 131 and the median was 97. The distribution of the length of the 1110 written responses for this scenario, shown in Fig. 4, demonstrated a more realistic long tail distribution like the second dataset, but with fewer responses being much longer than the rest. This distribution is more like our observations from prior work (Johnson et al. 2023; Katz et al., 2024; Paul et al., 2022), where we found that responses to open-ended survey questions often have a long-tailed distribution.

Distribution of response lengths for student extracurricular activity participation. Dashed line: mean (85.85), dotted line: median (80.00).
An example of a response focused on the theme “Nostalgia for Pre-Pandemic Work Environment” and sub-theme “Nostalgia for Office Culture and Traditions” that has a more varied writing style is the following: “I’m so ready to be back in the office… miss the energy of being around my colleagues all day… Friday team lunches at the new restaurant down the street… celebrating milestones and birthdays with cake and balloons… it’s those little things that made coming to work feel special… our team was like a family, always supporting each other… I hope we can get back to that soon… virtual happy hours just aren’t the same…”. An additional example simulated response from the persona of a working mother in this synthetic dataset about perspectives on returning to the office after the pandemic is in Supplementary Material S.3. We have provided these examples for the datasets to illustrate to the reader how the themes and sub-themes could manifest in the simulated data because the notion of an AI workflow evaluating AI-generated data may appear meaningless. Our suggestion is that these simulated data actually represent realistic responses because of how we embedded the themes, sub-themes, personas, contexts, and writing styles. This approach to using LLMs for generating simulated data is also an approach applied elsewhere in social science research (Argyle et al., 2023; Gao et al., 2024).
With these three synthetic datasets generated, we were able to test the GATOS workflow to see the extent to which the process could identify the themes and sub-themes used to generate the data.
GATOS workflow overview
The task we seek to solve with this method is to find recurring patterns in text data collected in realistic simulated research settings. Our solution was to combine several NLP tools and techniques with generative text models into a multi-step workflow. We use an open-weights generative text model Mistral-22b-2409 and modern NLP techniques (i.e., text embedding) to enable inductive qualitative data analysis at a large scale. By inductive, we mean a data-driven approach to generate a codebook rather than purely theory-driven. This is the kind of approach one may take when not knowing a priori what is discussed in the text. The researcher could also take a hybrid approach of providing their own codes as well based on their specific theoretical framework or research question in a more human-in-the-loop approach (Anakok et al., 2025). The generated codebook can then be used to label the original text units according to their themes. This application step is beyond the scope of the current paper and will be described in future work.
We break this inductive codebook generation process down into multiple parts. First, summarize the original text units of analysis (e.g., individual written responses to open-ended survey questions) in the context of the researchers’ specific research questions, which they provide as part of their instructions to the LLM. This produces a list of individual summary points analogous to observation memos that a research might make to summarize each observation they make as they read their data. Second, take all the atomic research-relevant summary points and use a text embedding model to generate high-dimensional numeric representations of each point. Third, reduce the dimensionality of those text embeddings to a lower-dimensional space to enable step four—clustering the embedded summary points. In theory, these clusters should contain semantically similar summary points. For example, summary points such as ‘frequent emails reminders’ and ‘constantly sent info to help stay on track’ could be clustered together since they are about the same idea (i.e., team leader communication about progress). At this point in the process, we have gone from an initial set of raw text units to a smaller set of clusters of semantically similar text units; however, we still do not know what clusters are necessarily about—only that most of the clustered texts are somehow similar.
Up to now, many of these steps have been explored in prior research. The novelty of this workflow comes in step five. The goals of step five (codebook generation) are two-fold and contend with each other: (1) to generate a code for each cluster and (2) try to avoid generating too many redundant codes. This aims to mimic how a researcher might code data in a traditional qualitative data analysis setting. For example, the researcher might begin by reading their data and generating codes (i.e., short descriptive phrases accompanied by definitions, depending on their coding method) as they encounter new ideas. However, when they see data described by a code that already exists in their burgeoning codebook, they would not generate a new code and instead move on to the next piece of text. At each data point, therefore, the researcher performs multiple tasks: identify what is discussed in the data; think about whether it warrants a code; check whether a code already exists that would describe it; and, if not, create that new code and add it to the codebook.
In step five, we mimic that reflection process with the generative text model and retrieval augmented generation (RAG). We use a RAG approach as a way of managing the context that the LLM needs to attend to. Whereas we could provide the LLM the entire codebook to consider, in practice that might provide too much distracting information to the LLM. It is the analog of providing a researcher the k most relevant codes in the codebook to think about and make salient in their deliberation rather than making thinking about all the codes at once. Therefore, to operationalize this RAG approach here, we first take the cluster of text and find the k most semantically similar codes for each summary point in the cluster (usually, k is on the order of 2 to 4) using the embeddings for the summary points, embeddings for the existing codes, and calculating their cosine similarities. We then aggregate those nearest neighbor codes into a set, thereby removing redundancies, to generate a list of unique nearest neighbor codes for that cluster. For example, if there are six summary points in a cluster, we would find 6 ∗ k nearest neighbor codes (from the growing codebook) for that cluster, though this list may have multiple copies of the same codes. If the six summary points are all about the team leader sending email reminders, we look for existing codes in the codebook that are most similar to this idea, but that may only result in two or three unique existing codes in the codebook. Those unique codes are then included in the prompt to the generative text model to decide whether to generate a new code for that cluster.
At a philosophical level, at this point in the process, it is still an open question whether those ‘most similar’ codes actually capture the idea(s) expressed in that cluster. This is analogous to a researcher having thought of similar codes in their codebook that might be applied to the data they are currently reading, but now needing to assess whether or not the code is appropriate to describe the data. To investigate this question, we instruct a generative text model to look at the cluster of (n) summary points, the existing codes in the codebook (as represented by the ≤n ∗ k nearest neighbor codes), and decide whether or not a new code is needed based on whether the existing codes in the codebook provide sufficient thematic coverage of the cluster of summary points. If the model decides a new code(s) is (are) needed, it generates a new code and definition for that code, which is added to the codebook. If the model decides a new code is not needed, the process simply moves on to the next cluster of data points. The full prompt for this code consideration step is in Supplementary material S.6.
By the end of step five, we have gone through each cluster of summary points and either identified a new code or decided that no new code was needed, thereby balancing the goals of identifying recurring patterns in the summary points while not generating too many redundant codes. In practice, there are still many near redundancies that exist, so the final step in is to cluster these newly generated codes and prompt a model to identify distinct themes. The process culminates with a list of themes and codes belonging to those themes. This entire workflow is shown in Fig. 5. We call this workflow the Generative AI-enabled Theme Organization and Structuring (GATOS) method because it is designed to mimic parts of thematic analysis while also being distinct from traditional thematic analysis.
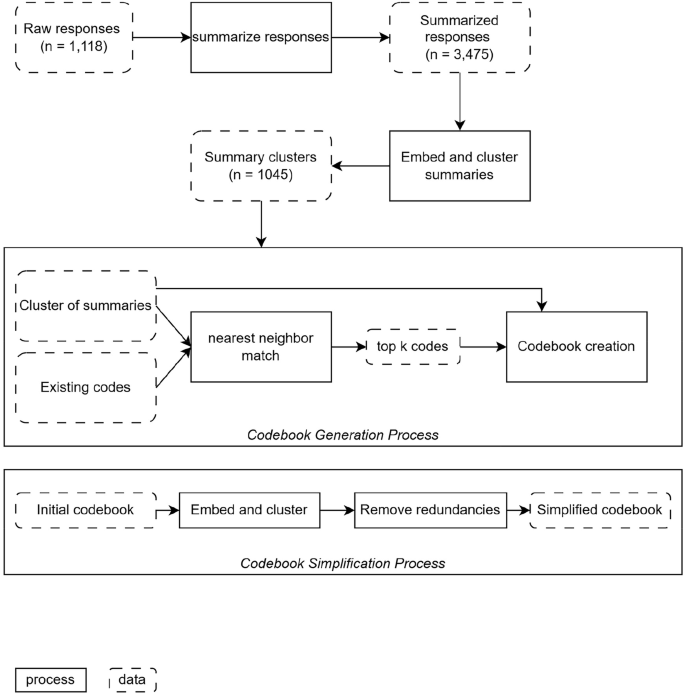
Process for the GATOS workflow.
For evaluation purposes in this study, the final step was to compare the themes generated through this process with the (8) themes and (8 ∗ 8) sub-themes used to simulate the original data. The details of each step in the workflow and procedures to evaluate our workflow are described in more detail in Supplementary Material S.4.
Evaluation process
To evaluate the quality of the workflow’s codebooks, we primarily used a manual approach because human judgment was required to assess the quality of matches. We did not use traditional machine learning metrics here (e.g., precision, recall) because the determination of whether there were good (defined momentarily) matches did not seem like it fit the model of a typical ML classification task. Instead, we framed the task as one where (for each of the three datasets) we had two sets of codes (our pre-defined/original sub-themes (i.e., codes), set A, and then the codes from the workflow, set B, and needed to determine if there was a least one match from set B for each item in set A. In that framing, the task required human raters to determine what constituted a good match, where good meant the semantics of the code in set B matched the semantics of the code in set A. Conversely, a “bad” match meant that members of the research team did not identify a semantically similar code in set B for a code in set A. The three ratings for these matches were “good match”, “partial match”, and “no match”. We performed this evaluation for the original sub-themes (compared with the generated codes) and original themes (compared with the generated themes) for each dataset. In addition to those manual ratings, we also calculated the semantic similarity between each sub-theme and the codes generated for that dataset so that we could plot semantic similarity scores between each sub-theme and its best match as additional weaker evidence of matches.


