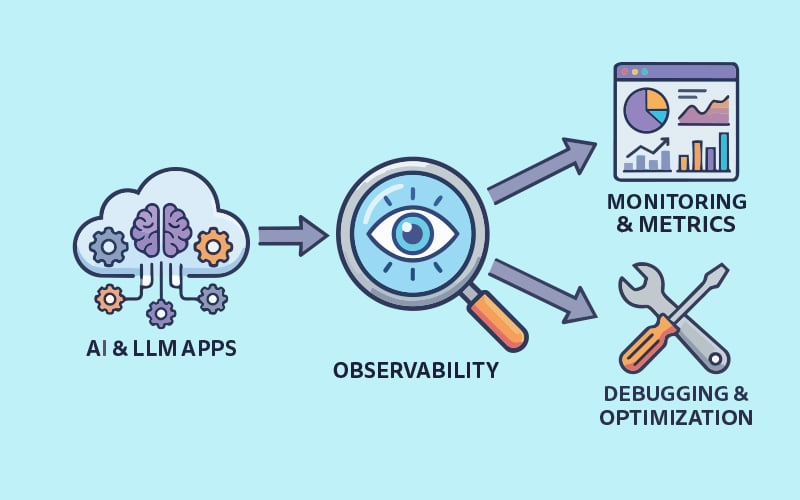

Open source tools are allowing teams to build observability into AI and LLM applications without surrendering control of sensitive prompts, outputs, or internal workflows.
As AI-powered systems move from experimentation into everyday business operations, the need to understand their behaviour in production has become impossible to ignore. Traditional application monitoring was designed for deterministic software, where the same input generally leads to the same output. AI services and large language model (LLM) applications do not behave in that predictable way. Their outputs can vary, their costs can fluctuate with token usage, and their quality can shift depending on prompts, retrieved context, model versions, orchestration logic, and user intent. That is why observability has become a foundational discipline for AI engineering. In this context, observability is not just about checking whether a service is up or down. It is about gaining enough visibility into prompts, responses, retrieval steps, tool calls, latency, failures, token consumption, safety signals, and user feedback so teams can diagnose issues, improve quality, and operate AI systems with confidence at scale.
What observability means in AI and LLM systems
In conventional software systems, observability usually refers to the ability to infer internal system state by examining external outputs such as metrics, logs, and traces. The same principle applies to AI systems, but the operational questions are broader and more nuanced. Teams are no longer asking only whether a request failed. They also need to know why a response was inaccurate, which document retrieval step introduced irrelevant context, whether a prompt template regressed after a change, why latency increased for a certain model, or how token costs spiked after a new rollout.
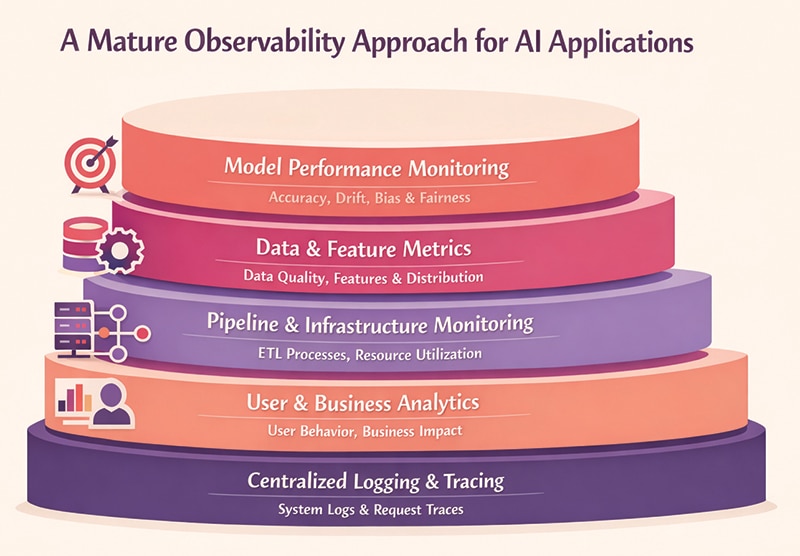
A mature observability approach for AI applications usually combines several layers of insight (Figure 1). Traces help teams follow the full journey of a request from user input to retrieval, prompt assembly, model invocation, tool usage, guardrail checks, and final response. Metrics provide aggregate visibility into latency, throughput, token usage, cost, failure rates, and response patterns. Logs preserve detailed execution events for later debugging. Evaluations add another dimension by measuring quality, groundedness, relevance, safety, or task completion. When these signals are correlated, engineering teams can move beyond guesswork and begin managing AI systems with the same rigour expected from any production service.
Why observability is essential for AI services and LLM applications
The value of observability becomes clear the moment an AI feature is exposed to real users. A chatbot may return fluent answers that appear convincing but are not grounded in enterprise knowledge. An RAG pipeline may retrieve irrelevant passages, causing the model to answer with high confidence and low accuracy. An agentic workflow may call the wrong tool, loop unnecessarily, or exceed latency budgets. Without observability, these failures often surface as vague complaints from users rather than precise engineering signals. Teams spend time guessing which part of the pipeline is responsible, and improvements become slow and expensive.
Observability is equally important from an operational and financial perspective. LLM applications are not only compute-intensive — they are also usage-sensitive. Small changes in prompt length, retrieval depth, model choice, or conversation memory can materially alter token consumption and therefore cost. End-to-end tracing makes these shifts visible. It also helps organisations enforce governance by showing which model was invoked, what context was supplied, whether sensitive data appeared in prompts or outputs, and how long each step took. For teams operating under security, privacy, or compliance constraints, this visibility is not a convenience. It is a prerequisite for responsible deployment.
Another reason observability matters is that AI systems improve through iteration. Teams constantly refine prompt templates, swap models, tune retrieval strategies, introduce safety filters, and redesign agent workflows. Each change can improve one dimension while degrading another.
Key signals to monitor in AI and LLM workloads
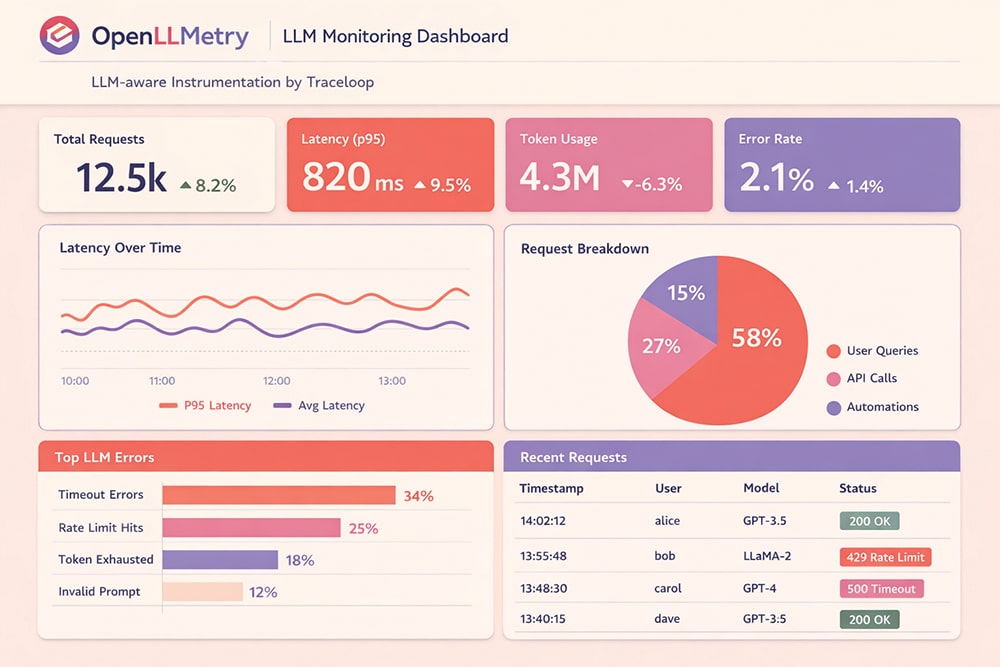
Useful observability for AI systems begins with collecting the right signals. At the request level, teams typically monitor latency, throughput, success and failure rates, retry behaviour, and time spent in downstream dependencies such as vector databases or external APIs. At the model level, token counts, prompt size, completion size, provider metadata, model version, and estimated cost are essential. In RAG architectures, retrieval-specific signals matter just as much: document recall, ranking quality, chunk relevance, source coverage, and the relationship between retrieved context and final response. In agentic systems, tool invocation paths, decision sequences, fallback behaviour, and loop detection become critical.
Operational telemetry alone is not enough. AI applications also require quality and safety signals. These may include groundedness, factual consistency, relevance, response coherence, refusal behaviour, harmful content detection, prompt injection indicators, policy violations, and user feedback scores. Many teams also track business-aligned outcomes such as task completion, deflection rate, conversion impact, or escalation frequency. The real strength of AI observability comes from linking these qualitative measures with technical telemetry. When a drop in relevance can be tied to a prompt revision or a retrieval latency spike, root cause analysis becomes far more actionable.
Open source observability tools for AI and LLM applications
The open source ecosystem for AI observability has evolved rapidly. Some tools focus on instrumentation and standards, others on trace visualisation, prompt analytics, evaluation workflows, or cost tracking. The strongest implementations often combine more than one component: a standard telemetry layer, a trace collection pipeline, and a specialised interface for AI-specific analysis. Choosing among them depends on architecture, privacy requirements, engineering maturity, and whether the team prefers SDK-based integration, proxy-based capture, or a hybrid model.
OpenTelemetry and OpenLLMetry: OpenTelemetry has become one of the most important foundations for AI observability because it offers a vendor-neutral way to collect traces, metrics, and logs across distributed systems. For AI and LLM workloads, this matters because model calls rarely live in isolation. They are part of larger workflows that include web applications, APIs, retrieval services, orchestration frameworks, caches, databases, and external tools. By instrumenting AI flows with OpenTelemetry, teams can connect model behaviour with the rest of the application stack instead of operating two separate monitoring worlds.
OpenLLMetry, from the Traceloop ecosystem, builds on OpenTelemetry to add LLM-aware instrumentation. It helps capture model invocations, prompt and completion metadata, token usage, retries, errors, and interactions with frameworks such as LangChain, LlamaIndex, and related libraries.
Its significance goes beyond convenience. OpenLLMetry aligns AI telemetry with emerging semantic conventions for generative AI, making it easier to move data between observability backends without rewriting instrumentation.
OpenInference and Arize Phoenix: OpenInference provides a complementary set of conventions and instrumentation patterns for AI application tracing. It is designed to describe LLM calls, retrieval events, embeddings, tool usage, and surrounding application context in a consistent format. This is especially helpful in complex systems where teams want observability data to preserve meaning rather than exist as generic spans with unclear attributes. Clear conventions improve downstream analysis because they make traces easier to compare, filter, and evaluate.
Arize Phoenix is widely used as an open source platform for inspecting and debugging LLM applications, especially RAG systems. It offers trace visualisation, dataset analysis, evaluation support, and workflow inspection in a way that is approachable for both engineers and applied AI teams. One of its strengths is that it helps teams move from raw telemetry to interpretability. Instead of only seeing that a request failed or slowed down, users can inspect retrieval context, compare outputs, study response patterns, and investigate why a chain or agent behaved the way it did.
Langfuse: Langfuse is one of the best-known open source platforms built specifically for LLM engineering workflows. It combines tracing, prompt observation, version tracking, usage analytics, and evaluation-oriented features in a single environment. For teams building chatbots, copilots, search assistants, or multi-step chains, Langfuse offers a practical way to inspect how prompts evolve, how model responses vary across versions, and where latency or cost accumulates along a workflow.
Helicone: Helicone takes a different approach by acting as a proxy layer for model traffic. This design is useful when teams want fast visibility with minimal code change. By routing LLM requests through a proxy, organisations can capture usage, latency, cost, and response metadata across providers without deeply modifying application logic. That makes it attractive in environments where speed of adoption matters or where multiple teams share common AI gateways. Proxy-based observability is not always as expressive as deep in-process instrumentation, but it can provide a practical and low-friction starting point for gaining operational insight into production traffic.
MLflow: MLflow is traditionally associated with machine learning lifecycle management, but it remains relevant in AI and LLM observability because experiment tracking and model governance are closely tied to production behaviour. In LLM-centric workloads, MLflow can help record prompt variants, evaluation outcomes, parameter settings, model versions, and deployment metadata. While it is not a specialised tracing tool in the same way as Langfuse or Phoenix, it provides a valuable layer of reproducibility. Teams that want to compare model behaviour across experiments, retain lineage, and connect offline evaluation with online performance often find MLflow useful as part of a broader observability stack.
TruLens: TruLens is especially valuable when the main question is not just how the system performed, but whether the response was actually good. It brings an evaluation-centric lens to observability by helping teams assess groundedness, relevance, and output quality in RAG and LLM applications. This makes it well suited to environments where correctness and trust matter more than raw throughput. In practice, tools such as TruLens fill an important gap: conventional telemetry can reveal that a request completed successfully, yet still say nothing about whether the answer was useful, accurate, or aligned with expectations.
OpenLIT: OpenLIT has emerged as another notable open source option for monitoring LLM applications and AI pipelines. Its focus is on making it easier to capture core runtime signals such as usage, latency, failures, and execution details without forcing teams into a heavy platform commitment. For organisations that want open deployment choices and straightforward instrumentation, tools in this category are appealing because they reduce the distance between experimentation and production operations. They also help smaller teams adopt observability earlier, before operational issues become expensive to untangle.
PostHog and Lunary: PostHog and Lunary reflect two useful directions in the open source landscape. PostHog extends AI observability into product analytics, allowing teams to connect model interactions with user behaviour, experiments, and application outcomes. This is valuable when the business impact of AI features matters as much as technical correctness. Lunary, on the other hand, is often discussed in the context of lightweight observability for chatbot and RAG-oriented flows, where understanding prompt execution and retrieval behaviour is central. Both illustrate an important reality: AI observability is not only about infrastructure telemetry. It also needs to connect with user experience, evaluation loops, and product decision-making.
In practice, no single tool solves every observability need. OpenTelemetry and related conventions provide portability and integration depth. Langfuse and Phoenix offer rich LLM-specific inspection experiences. Helicone simplifies adoption through proxy-based capture. TruLens strengthens evaluation workflows. MLflow supports experiment governance and reproducibility. PostHog adds product context. The most resilient architecture is usually composable, with standardised telemetry at the base and specialised tools layered on top for analysis, debugging, and quality management.
How observability helps in real AI and LLM service architectures
In real AI and LLM service architectures, observability acts as the connective tissue between application behaviour, model behaviour, infrastructure performance, and business outcomes. A typical production LLM system is rarely a single model call. It often includes an API gateway, authentication layer, prompt orchestration service, retrieval pipeline, vector database, embedding model, reranker, LLM provider, tool-calling layer, guardrails, caching service, feedback capture mechanism, and monitoring backend. Each component can affect the final response. Observability helps engineering teams understand how these components interact across the full request lifecycle.
Consider a retrieval-augmented generation application used for enterprise knowledge assistance. A user submits a question, the system embeds the query, searches a vector database, retrieves candidate chunks, reranks them, constructs a prompt, sends it to an LLM, applies safety checks, and returns an answer with citations. If the answer is poor, the root cause may not be the LLM itself. The embedding model may have produced weak semantic matches, the vector index may have returned outdated documents, chunking may have broken context, the reranker may have prioritised irrelevant passages, or the prompt may have failed to instruct the model to stay grounded. Without request-level tracing and retrieval-level telemetry, these failures remain hidden. With observability, teams can inspect the exact documents retrieved, similarity scores, prompt version, model response, token usage, latency, and evaluation scores for groundedness or relevance.
The same principle applies to agentic AI systems. Modern AI agents may plan tasks, call APIs, query databases, execute code, invoke search tools, and decide whether to retry or escalate. These systems are powerful but operationally complex. Observability makes agent behaviour visible by recording tool invocation paths, intermediate decisions, errors, retries, loop patterns, and final outcomes. If an agent repeatedly calls the same tool, exceeds cost thresholds, or selects the wrong function, traces can reveal where the planning logic failed. This is especially important as organisations move towards multi-agent workflows and autonomous business process automation.
Observability also supports performance and cost optimisation. LLM applications are sensitive to token volume, context-window size, model choice, and conversation memory. A small change in prompt design or retrieval depth can significantly increase latency and provider cost. By correlating token usage, response time, cache hit rate, model version, and user segment, teams can identify expensive paths and optimise intelligently. For example, simple queries may be routed to a smaller model, while complex reasoning tasks can use a more capable model. Frequently repeated requests can be cached, and long context can be compressed or summarised.
From a governance perspective, observability provides the audit trail needed for responsible AI deployment. It shows what data entered the model, which guardrails were triggered, whether sensitive information appeared in prompts or outputs, and how human feedback influenced improvements. In production architectures, this visibility is not optional. It enables debugging, evaluation, compliance, cost control, and continuous improvement across the complete AI service lifecycle.
Best practices for building an effective AI observability strategy
Building an effective AI observability strategy requires more than adding logs around model calls. It begins with designing observability as a core architectural capability from the earliest stages of AI application development.
As a best practice, instrument the complete end-to-end workflow, not just the LLM invocation. In modern AI systems, quality depends on prompt construction, retrieval, embeddings, reranking, tool calls, guardrails, memory, model selection, and post-processing. Each step should generate structured telemetry so teams can reconstruct the full path from user input to final output. Distributed tracing using OpenTelemetry, OpenLLMetry, or OpenInference conventions provides a strong foundation because it allows AI-specific events to be correlated with application and infrastructure telemetry.
Second, define meaningful metrics across four dimensions: performance, cost, quality, and safety. Performance metrics should include latency, throughput, failure rate, retry count, timeout rate, and dependency response time. Cost metrics should track prompt tokens, completion tokens, embedding tokens, model cost, cache savings, and cost per successful task. Quality metrics should measure groundedness, relevance, factual consistency, citation accuracy, response completeness, and user satisfaction. Safety metrics should include harmful content detection, prompt injection attempts, data leakage indicators, refusal accuracy, and policy violations. Monitoring only infrastructure metrics gives an incomplete picture; AI systems require behavioural and semantic observability.
Another best practice is to connect online observability with offline evaluation. Production traces should be sampled and converted into evaluation datasets. These datasets can be used to compare prompt versions, model upgrades, retrieval strategies, and agent logic before deployment. Tools such as Langfuse, Arize Phoenix, TruLens, and MLflow can support this feedback loop by linking traces, experiments, evaluation scores, and model or prompt versions. This creates a disciplined improvement cycle where changes are validated with evidence rather than intuition.
Teams should also implement prompt and model versioning. Every production response should be traceable to a specific prompt template, model version, retrieval configuration, embedding model, and safety policy. This is essential for regression analysis. If answer quality drops after a rollout, teams must be able to identify exactly what changed. Canary releases, A/B testing, and automated evaluations should be used before fully deploying new prompts, models, or orchestration logic.
Data governance must be built into the observability pipeline. Prompts and responses may contain personally identifiable information, confidential business data, or regulated content. Therefore, teams should apply redaction, encryption, access control, retention policies, and environment separation. Sensitive payloads should be masked where possible, while still preserving enough metadata for debugging and evaluation.
Challenges and future direction
Despite rapid progress, AI observability is still an evolving discipline. Standards for semantic conventions, evaluation methods, and agent tracing are improving but not yet universally settled. Different frameworks emit different metadata, providers vary in what they expose, and quality measurement remains partly domain specific. Even so, the direction is clear. The industry is moving towards richer trace semantics, stronger evaluation integration, and more unified telemetry pipelines that can cover infrastructure, applications, and AI workflows together.
Observability for AI and LLM applications is no longer optional. It is the discipline that turns opaque, probabilistic systems into services that can be understood, trusted, and improved. By combining traces, metrics, logs, evaluations, and governance controls, organisations can diagnose failures faster, optimise cost, improve response quality, and deploy AI capabilities with greater confidence. Open source tools contribute an important piece of this ecosystem. Together, they help engineering teams build AI services that are not only intelligent, but also observable, accountable, and ready for production at scale.