In the RMSE comparison table, “Model (A)” uses global data composed of all other categories, while “Model (B)” uses global data composed only of categories highly correlated with the target category, which are marked in bold in the correlation table.
Foursquare Tokyo
Table 2 shows the data correlation between categories, which significantly affects the performance of the proposed model. Table 3 shows the prediction accuracy of both the baseline and proposed models. The improved performance of the proposed method over other methods is due to its unique approach. Unlike existing models, which usually rely only on the target category data to predict one of the data subcategories, our method uses a combination of both aggregated (global) and segmented (local) data.
From Table 2, we can see that the overall correlations range from – 0.008 to 0.651. The correlations between categories are generally not very strong, with the highest correlation being 0.651. This is also reflected in the RMSE comparison results in Table 3, which show that the performance gains from using global data are not significant. Specifically, the higher the correlations between categories, the more significant the gain in predictive performance from incorporating global data.
Category 1 (arts and entertainment) \(0.131-0.479\) Correlations with other categories are observed, with six categories showing correlations higher than the correlation threshold N(0.31), which is relatively high in this case. This correlation pattern results in a 5.4% reduction in error when all categories are included as global data. Furthermore, when we conduct experiments using global data and exclude categories 3, 5, and 8, which have relatively low correlations with the target category, we see a further 1.3% reduction in error in Table 3. We can see that category 4 (Food) and category 9 (Shops and Services) also show a similar trend.
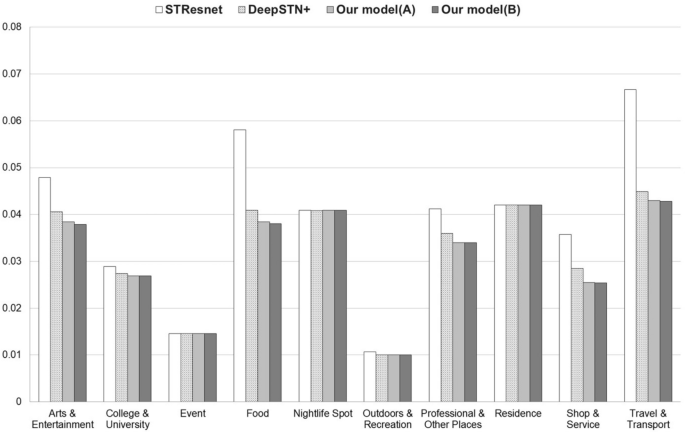
Foursquare Tokyo RMSE comparison.
Concerning category 7 (Occupation and Other Locations) and category 10 (Travel and Transportation), we observe that structuring global data for all categories reduces the prediction error, but no further improvement is observed when structuring global data based on correlation, which needs to be further analyzed.
For categories 2 (Universities), 3 (Events), 5 (Nightlife Spots), 6 (Outdoors and Recreation), and 8 (Outdoors and Recreation), using global data does not seem to improve performance since the correlation between these categories and the other categories is lower than the N threshold.
Figure 2 shows that the proposed model performs better than the baseline model on the Foursquare Tokyo dataset.
Foursquare New York
Table 4 shows that the correlations between the categories range from -0.008 to 0.655. Overall, the correlations between the categories are not particularly strong, with the maximum correlation being 0.655, which is also reflected in the RMSE performance results in Table 5. As shown in Table 5, the performance gains range from 5.2 to 6.96%, which is not significant compared to the performance gains observed in the Gowalla data, as we will see later. Furthermore, the performance gains tend to be proportional to the correlations between the categories. Category 1 (Arts and Entertainment) shows correlations between 0.086 and 0.589, and five categories show significant correlations with Category 1 higher than the N(0.31) threshold.
This reduces the error by 6.1% when including all categories as global data, and further reduces the error by an additional 0.7% when constructing the global data by excluding categories 2, 3, 5, and 8, which have relatively low correlations.
Similar trends are seen in categories 6 (outdoor and recreation), 7 (professionals) and 9 (shops and services).
For category 4 (food), including all categories in the global data reduces the error by 6.4%, but structuring the global data to account for correlations does not provide any further improvement. Similarly, for category 10 (travel and transportation), using global data does not provide any performance improvement and requires further investigation.
Gowara Global
Looking at the inter-category correlation analysis results in Table 6, we can see that the overall correlation ranges from a minimum of 0.775 to a maximum of 0.906. Considering that the inter-category correlation of the Foursquare data is a maximum of 0.65, we can conclude that the inter-category correlation of Gowalla is generally stronger than that of Foursquare. Looking at the experimental results in Table 7, Gowalla's error reduction ranges from 6.3 to 36.1%, which is significantly higher than the error reduction rate of Foursquare (1.5 to 2.0%). \(\sim 10.9\%\)Here again, we see that the performance gain when using global data tends to be proportional to the correlation between categories.
Additionally, the difference in correlation between categories in Gowalla is smaller than that in Foursquare, so we expect the performance gain from structuring global data to account for correlation to be smaller for Gowalla than for Foursquare.
Foursquare sees five categories where the performance improves when composing global data with correlation in mind, whereas Gowalla sees only two categories where the performance improves further. We can infer that as the difference in correlation between categories increases, composing global data with correlation in mind tends to improve performance.
For category 3 (food), the correlation with other categories ranges from 0.775 to 0.906, and the difference between the maximum and minimum correlations is 0.131, which is relatively high compared to other categories in Gowalla Global. Further performance improvements can be expected when configuring global data with correlation in mind. As expected, experimental results show that configuring global data with correlation in mind reduces the prediction error by 7.55%. Category 7 (travel) shows a similar trend.
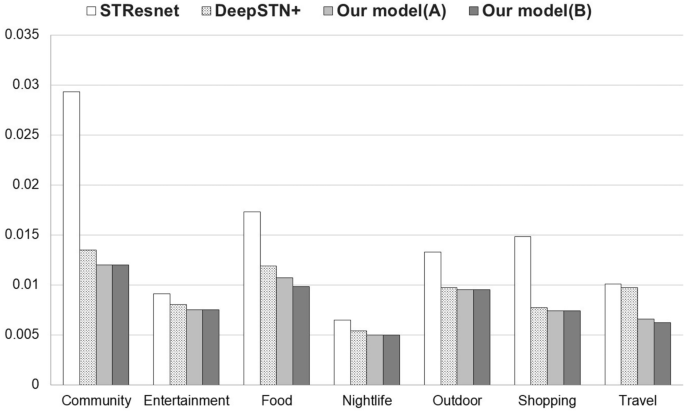
Gowalla Global RMSE Comparison.
For categories 1 (Community), 2 (Entertainment), and 4 (Nightlife), the correlations between the categories are high and the differences in correlations between the categories are relatively small, so constructing the global data to account for the correlations in these categories is unlikely to improve performance further.
Figure 3 shows that the proposed model provides better performance than the baseline model on the Gowalla Global dataset.
Gowalla America
Looking at the correlation analysis results between categories in Table 8, we can see that the overall correlation is in the range of 0.797 to 0.9. From the experimental results in Table 9, the performance improvement is 12.5 to 43.5%, which is higher than that of Gowalla global. Although there is no significant difference in the correlation, the reason for this is inferred from the amount of data. In the case of Gowalla America, only samples from the Americas region are selected from Gowalla global, so the number of samples is small. It can be seen that the smaller the number of samples, the better the performance is by using global data that includes all other categories.
In the Gowalla America data, the correlation between the target measurement category and other categories is generally high, and the correlation difference between categories is also small, so that when global data is constructed with all categories, the performance is significantly improved, but when global data is constructed taking correlation into account, the further performance improvement is not significant.
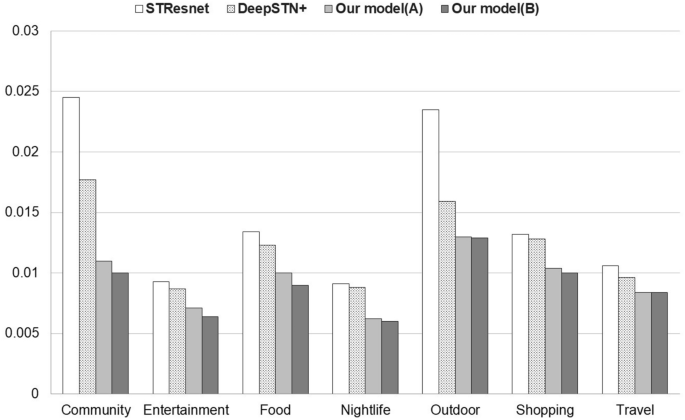
Gowalla America RMSE comparison.
This can also be seen from the experimental results in Table 9. When the global data is composed of all categories, the average error reduction rate is 22%, which is 8.6% higher than Gowalla Global (13.4%). When the global data is composed taking correlation into account, a slight improvement is observed, but the RMSE itself does not differ significantly.
Figure 4 shows that the proposed model provides better performance than the baseline model on the Gowalla America dataset.
Gowalla Asia/Europe/Africa etc.
Looking at the correlation analysis results between categories in Table 10, we can see that the overall correlation is in the range of 0.734 to 0.921. According to the experimental results in Table 11, the RMSE reduction of Gowalla Asia/Europe/Africa is 9.71 to 48.65%, which is almost the same as the performance improvement level of Gowalla America.
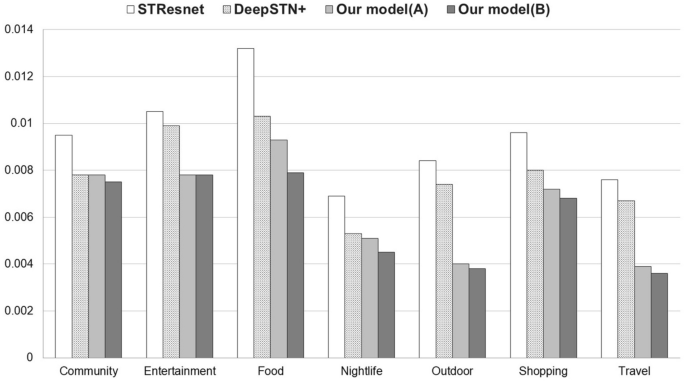
Gowalla RMSE comparison for Asia/Europe/Africa etc.
Figure 5 shows that the proposed model performs better than the baseline model on the Asia/Europe/Africa dataset.