Data source, study population, and design
This study utilized the recent (2015–2024) Demographic and Health Survey (DHS) data from 23 SSA countries, representing regions such as East Africa, Central Africa, Southern Africa, and West Africa. The countries and corresponding survey years included in the analysis are as follows: Angola (2015), Benin (2017/18), Burkina Faso (2021), Burundi (2016/17), Côte d’Ivoire (2021), Ethiopia (2016), Gambia (2019/20), Ghana (2022), Kenya (2022), Liberia (2019/20), Madagascar (2021), Malawi (2015/16), Mali (2023/24), Mauritania (2019/21), Mozambique (2022/23), Nigeria (2023/24), Senegal (2023), Sierra Leone (2019), South Africa (2016), Tanzania (2022), Uganda (2016), Zambia (2018), and Zimbabwe (2023/24). This study selected 23 sub-Saharan African countries in this study because they were the only countries with a DHS conducted in 2015 or later. This criterion ensured that only recent and comparable data were analyzed, allowing us to reflect the current child health situation across the region. Countries without a DHS after 2015 were excluded to maintain data recency and consistency. The DHS employs a cross-sectional survey design, ensuring nationally representative data collection for each participating country. The DHS employs a standardized two-stage stratified sampling design. In the first stage, enumeration areas (EAs) were selected using probability proportional to size, stratified by region and urban-rural residence. In the second stage, a systematic sample of households was drawn from each selected EA. Data on live births within five years preceding the survey were extracted from the Kid Record (KR) files of each country. Because the DHS employs a complex, multistage sampling design, the individual sampling weight (v005) was normalized as sample weights to improve the representativeness and reduce bias. A total weighted sample of 190,930 participants were included in this study.
Target variables
The target variable for this study was under-five mortality, which was categorized as a binary outcome. A child was coded as 1 if they died before reaching five years of age and 0 if they were alive at the time of the survey. This classification was used to analyze the factors influencing under-five mortality and to develop predictive models for identifying children at higher risk.
Features/independent variables
Maternal age, household wealth, maternal education, maternal employment, family size, husband’s education, husband’s occupation, age at first birth, postnatal care (PNC), place of delivery, country, place of residence, and access to healthcare services are some of the important factors influencing under-five mortality that were investigated in this study. These variables are crucial to predict mortality among children under-five. For variables such as husband’s education and occupation, respondents without a spouse or partner were coded as “No Husband.” Rather than imputing these as missing, this category was retained as an informative class to allow the machine learning algorithms to detect patterns related to marital status. This strategy avoids data loss while preserving potentially predictive signals.
Data preprocessing and feature selection
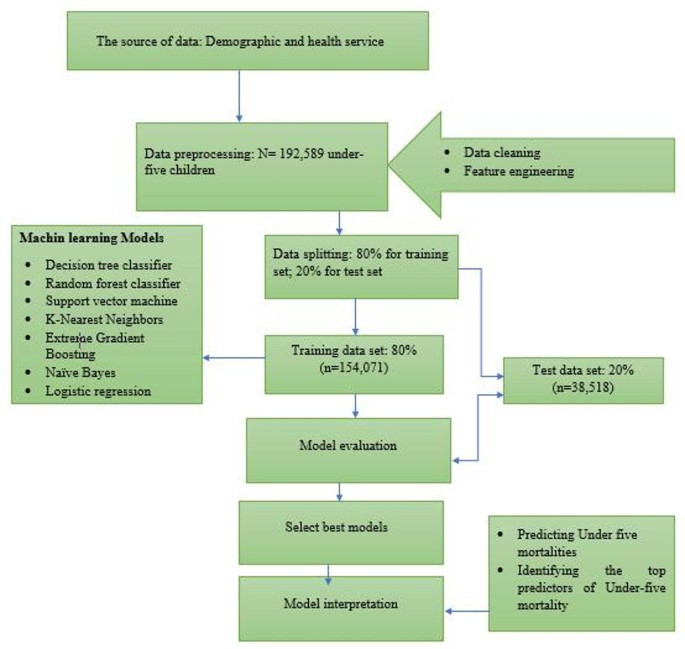
STATA version 18 was used to extract the data, and imported to Jupyter Notebook for further statistical analysis. Python 3.12 was used for all studies in Jupyter Notebook, with the help of modules like Pandas, Seaborn, SMOTE, Scikit-Learn, and SHAP. The first step in ML is data pre-processing, which involves preparing and transforming the data to make it understandable for computers. In this study, the ML process focused on the outcome variable of under-five mortality, along with various independent variables outlined in the above subsection. A set of relevant features was selected based on prior research and domain knowledge. Variables related to maternal characteristics, child health, healthcare access, and socioeconomic factors were included. This study utilized the Boruta algorithm to identify the most significant variables for predicting under-five mortality. By selecting the most relevant features, this approach helps reveal key patterns linked to child mortality, offering deeper insights into the factors influencing survival among children under-five. Categorical features were encoded using one-hot encoding and label encoding to improve model performance. The dataset was split into training (80%) and testing (20%) subsets to evaluate model performance (Fig. 1).

The architecture of machine learning algorithms designed to under-five mortalities among sub-Sharan Africa.
Machine learning models
About 7 ML algorithms were applied to predict under-five mortality: Logistic Regression, Decision Tree Classifier, Random Forest Classifier (RF), Support Vector Machine (SVM), K-Nearest Neighbors (KNN), Extreme Gradient Boosting (XGBoost), and Naïve Bayes (NB). Each model was trained and tested using the preprocessed dataset, and their performance was assessed using evaluation metrics. These algorithms represent commonly used approaches in epidemiological prediction research due to their balance between interpretability, performance, and computational efficiency and are frequently applied in public health studies using survey data24. These models were chosen because they are computationally efficient, interpretable, and robust to class imbalance when combined with appropriate resampling techniques. Similar approaches have been recommended in public health prediction tasks, where a diverse set of models facilitates comparison of performance and generalizability25.
-
1.
Logistic Regression: A statistical model that employs a logistic function to model a binary dependent variable, useful for understanding the relationship between the dependent variable and one or more independent variables26.
-
2.
Decision Tree Classifier: A model that makes decisions based on asking a series of questions, creating a tree structure where each branch represents a decision rule, and each leaf represents an outcome26.
-
3.
Random Forest Classifier: An ensemble method that constructs multiple decision trees and merges them together to improve the accuracy and robustness of predictions. It helps to reduce overfitting compared to a single decision tree26.
-
4.
Support Vector Machine (SVM): A powerful algorithm that classifies data by finding the optimal hyperplane that separates different classes in high-dimensional space, making it effective for complex datasets26.
-
5.
K-Nearest Neighbors (KNN): An instance-based learning algorithm that classifies data points based on the classes of their nearest neighbors, making it inherently simple and effective for small datasets26.
-
6.
XGBoost: An efficient and scalable implementation of gradient boosting framework, known for its high performance and speed. It is particularly effective in handling large datasets and in competitions due to its robustness26.
-
7.
Naïve Bayes: A probabilistic classifier based on Bayes’ theorem, which assumes independence among predictors. It is effective for large datasets and performs well in text classification problems26.
Model evaluation metrics
To evaluate and compare the predictive capabilities of the models, five key performance metrics were utilized. Accuracy measured the overall correctness of the predictions, while precision assessed the proportion of correctly predicted positive cases among all predicted positives. Recall (sensitivity) evaluated the model’s ability to identify actual positive cases, and the F1 score provided a balanced measure between precision and recall. Additionally, the Area Under the Curve (AUC) was used to determine the model’s ability to differentiate between positive and negative cases27. These metrics collectively ensured a comprehensive assessment of model performance27,28,29.
To compare model performance, about 5 common key evaluation metrics were applied:
$$\:\text{A}\text{c}\text{c}\text{u}\text{r}\text{a}\text{c}\text{y}=\frac{\varvec{T}\varvec{P}+\varvec{T}\varvec{N}}{\varvec{T}\varvec{P}+\varvec{F}\varvec{N}+\varvec{T}\varvec{N}+\varvec{F}\varvec{P}}$$
$$\:\text{P}\text{r}\text{e}\text{c}\text{i}\text{s}\text{i}\text{o}\text{n}=\frac{TP}{TP+FP}$$
$$\:\text{R}\text{e}\text{c}\text{a}\text{l}\text{l}=\frac{TP}{TP+FN}$$
$$\:\text{F}1\:\text{s}\text{c}\text{o}\text{r}\text{e}=\frac{2*precision*recall}{precision+recall}$$
-
Receiver-Operating Characteristic Curve (ROC): is a visual representation of model performance across all thresholds. The ROC curve is drawn by calculating the True Positive Rate (TPR) and False Positive Rate (FPR) at every possible threshold, then graphing TPR over FPR.
These model performance metrics provided a comprehensive and robust evaluation of ML model’s predictive performance.
Data balancing and hyperparameter optimization
Due to the uneven distribution of classes in the dataset, the Synthetic Minority Over-sampling Technique (SMOTE) was applied to balance the data. Instead of merely duplicating instances from the minority class, SMOTE generates synthetic samples by interpolating between existing data points and their nearest neighbors. This method reduces bias toward the majority class while enhancing the model’s ability to generalize by creating a more diverse and representative training dataset. Applying SMOTE allows for a more equitable class distribution, ultimately improving the model’s predictive performance. By generating a balanced training set, SMOTE effectively mitigates the impact of survey weights in predictive modeling, as the model learns from the balanced dataset rather than the original population-weighted distribution. To improve model performance, hyperparameter tuning was conducted using a Grid Search approach with ten-fold cross-validation. This process systematically explored different parameter combinations to find the optimal settings for each algorithm30.
Feature selection
This study utilized the Boruta algorithm to identify the most significant variables for predicting under-five mortality. To identify the most relevant features for training our ML models, we used the Boruta algorithm a powerful, model-based feature selection technique built on the Random Forest classifier. Boruta works by creating shuffled versions of each feature, known as “shadow features,” and then testing whether the original features perform significantly better than these random counterparts. A feature is kept only if it consistently shows higher importance than the most important shadow feature. This approach gives us a reliable, data-driven way to identify truly meaningful predictors while filtering out noise. We chose Boruta over other feature selection methods for several reasons. First, it handles complex, high-dimensional data very well, which is typical in public health datasets. Second, unlike simpler filter methods (such as correlation scores or mutual information) that assess each feature in isolation, Boruta considers how features contribute to the model’s predictions collectively. Compared to other wrapper methods like Recursive Feature Elimination (RFE), Boruta is also more robust because it leverages the strength of ensemble learning and includes built-in statistical testing31. During our analysis, we compared Boruta with other feature selection approaches, including univariate filtering and RFE. We found that Boruta consistently improved model performance across key metrics such as AUC, F1-score, and precision. This confirmed its effectiveness in selecting features that enhance both accuracy and interpretability.
Model interpretability
SHAP (Shapley Additive Explanations) values were used to interpret the predictions of the best-performing model, which in this case was the random forest classifier. SHAP values provide insight into how each feature contributes to a model’s decision-making process. The results were visualized using SHAP beeswarm and bar plots, highlighting the most influential factors in predicting under-five mortality32.
Ethical consideration
This study did not require ethical clearance or participant consent, as it relied on secondary data from the Demographic and Health Surveys (DHS). Permission to access and utilize the data was granted by the DHS program (http://www.dhsprogram.com) following the submission of the study proposal. The dataset was anonymous and publicly accessible, ensuring participant confidentiality. Furthermore, all ethical considerations related to data collection were addressed in the DHS report.