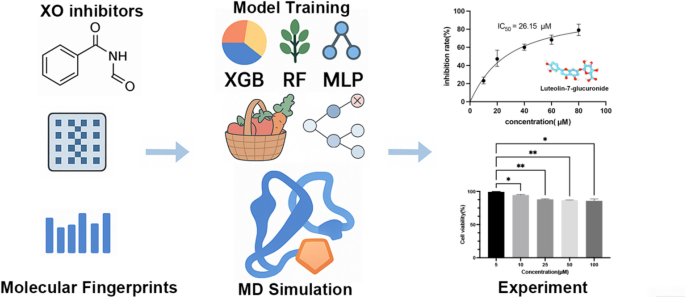
Dataset and data preprocessing
The positive dataset utilized in this study consists of 2,216 compounds consisting of known XO inhibitors collected from the PubChem database.28 and previously reported literature. To ensure effective model training, additional negative samples were randomly selected from PubChem to balance the dataset and alleviate class imbalance. Additionally, food-derived molecules were identified based on the list of homogeneous food and drug compounds published by the Chinese Ministry of Health, and their molecular structures were obtained from the TCMSP database.29. Specifically, the dataset was split into training, validation, and test sets in a 6:2:2 ratio.
SMILES string30 Collected and standardized using RDKit31 Ensure molecular consistency and reduce potential errors in structural representation. The standardization process involves converting SMILES strings to molecular objects, followed by normalization and desalting using the RDKit MolStandardize module. To maintain data integrity, invalid or unprocessable SMILES strings were identified and excluded from the dataset. The standardized molecular structures were then encoded into multiple fingerprint representations including MACCS.32Morgan, RDKit31topological twist33and atom pair34. These fingerprints serve as input features for machine learning models, allowing comprehensive molecular characterization and facilitating the development of predictive models.
clustering analysis
Molecular clustering was performed using extended fingerprints (2048 bits) generated from SMILES strings, utilizing the rcdk and rcdklibs libraries in R. Dimensionality reduction was applied using Rtsne with a perplexity of 20, followed by hierarchical clustering (Ward’s method) using the stats package. Representative molecules were selected based on the highest average Tanimoto similarity35calculated using the proxy package. Visualizations were generated using ggplot2 and representative molecules were clearly labeled and plotted in 2D t-SNE plots.36.
Machine learning model development and hyperparameter tuning
The machine learning framework in this study was designed to predict xanthine oxidase (XO) inhibitors using multiple fingerprint representations and algorithms. The implemented model includes a multilayer perceptron (MLP)37random forest38,XGBoost39. Each model was trained and evaluated using five molecular fingerprint types: MACCS, Morgan, RDKit, TopologicalTorsion, and Atom pairs.
For each fingerprint type, the dataset was divided into a training set and a test set using stratified sampling to maintain the class distribution. Data preprocessing includes handling missing values with mean imputation and scaling functions using the StandardScaler module. GridSearchCV was then used to perform hyperparameter tuning using five-fold cross-validation to optimize the area under the ROC curve (AUC).
The hyperparameter ranges for each model were defined as follows.
MLP: This model explored different network architectures: single-tier (50, 100 nodes) and two-tier (50, 50 nodes) configurations. Activation functions included tanh and relu, and the solver was set to stochastic gradient descent (sgd) or adam. Learning rates of 0.001 and 0.01 were tested with up to 10,000 iterations and optional early stopping to prevent overfitting.
Random Forest: The model varied the number of trees (100, 200, 300) and maximum depth (10, 20, 30, or unlimited). The minimum samples required to split a node range from 2 to 10, and the leaf size varies from 1 to 4 samples. Both bootstrap and non-bootstrap sampling were evaluated.
XGBoost: Key parameters include number of trees (100, 200, 300), maximum depth (3, 5, 7), learning rate (0.01, 0.1, 0.2), and subsampling ratio (0.8, 1.0). The column sampling ratio was also varied to assess the stability of the model.
Model evaluation includes calculation of key metrics such as sensitivity (SE), specificity (SP), precision (P), F1 score, accuracy (ACC), balanced accuracy (BA), Matthews correlation coefficient (MCC), and AUC. Furthermore, we plotted ROC curves to visualize the discriminatory ability of each model. The models that achieved the highest AUC and MCC scores were further analyzed to assess their robustness in discriminating between active and inactive compounds, with a focus on minimizing false positives and false negatives.
virtual screening
We used the trained model to screen 3,142 drug and food homologous compounds and selected compounds with prediction scores > 0.9 for further molecular docking.40, 41, 42. Docking was performed in AutoDock Vina using a 20 Å × 35 Å × 20 Å grid box centered at (x = − 22.8, y = 0.07, z = − 9.632). The 3D structure of the target protein was obtained from the Protein Data Bank (PDB ID: 3BDJ). To ensure the reliability of the molecular docking procedure, we performed redocking studies using the ligand oxypurinol cocrystallized from the template protein structure of xanthine oxidoreductase (PDB ID: 3BDJ). The cocrystallized ligand was extracted from the crystal structure and docked back into the active site of the receptor under the same docking parameters applied in the virtual screening experiment. The resulting docking pose was then compared to the crystal structure and the root mean square deviation (RMSD) of the heavy atoms was calculated. The obtained RMSD value of 0.092 Å indicates that the docking protocol was able to successfully reproduce the experimentally observed binding mode, validating the reliability of the docking setup (Figure S1).
Molecular dynamics simulation
Molecular dynamics (MD) simulations were performed using the PMEMD.CUDA module within the Amber 22 software suite. A total of 200 ns of simulation was performed for each system. The SHAKE algorithm was used to constrain all bonds involving hydrogen atoms, and the particle mesh Ewald (PME) method was applied to handle long-range electrostatic interactions, with a cutoff distance of 8 Å.
The MD workflow began with energy minimization to resolve steric clashes and optimize the initial structure. This process was divided into two stages. 500 steps of steepest descent followed by 500 steps of conjugate gradient method. After minimization, a stepwise heating phase was performed to increase the system temperature from 0 to 300 K over 50 ps. Subsequently, density equilibration for 50 ps was performed under NPT conditions at 300 K.10,43,44.
During the final equilibration phase, a constant pressure was maintained at 500 ps to ensure system stability before proceeding to production operation. Then, a production MD simulation was performed for 200 ns with a 2 fs time step, and a Langevin thermostat was applied with a collision frequency of 1 ps-.1. Data was recorded every 100 ps, resulting in a total of 2000 frames for each system, which provided the basis for subsequent structural and dynamic analyses.
XO inhibition assay and IC50 determination
The inhibitory activity of test compounds against XO was evaluated using a spectrophotometric method based on quantification of uric acid formation from xanthines. Uric acid production was monitored at 290 nm using a UV-visible spectrophotometer. The reaction system consisted of xanthine (0.5 mM), XO enzyme (0.02 U/mL), and 1/15 M phosphate-buffered saline (PBS) buffer maintained at pH 7.5. Test compounds including 5,4′-dihydroxyflavone, uralenol, and luteolin-7-glucuronide were prepared in a series of dilutions and dose-response curves were constructed. All reactions were performed at 25 °C for 25 min.
Absorbance values were collected at 290 nm after incubation. The inhibition rate was calculated using the following formula:
$${\text{Inhibition}}\,{\text{rate}}\left( \% \right) = \left[ {\left( {\left( {{\text{A3}} – {\text{A4}}} \right) – \left( {{\text{A1}} – {\text{A2}}} \right)} \right)/\left( {{\text{A3}} – {\text{A4}}} \right)} \right] \times {1}00$$
A1: Absorbance of test compound + xanthine + XO.
A2: Absorbance of test compound + xanthine (without enzyme).
A3: Absorbance of xanthine + XO (positive control).
A4: Absorbance of xanthine only (blank).
IC50 values (concentration required to inhibit 50% of XO activity) were determined by plotting the percent inhibition against the logarithm of the inhibitor concentration and performing nonlinear regression analysis. Quartz cuvettes were used for all spectrophotometric measurements to ensure UV transparency. Reaction controls are included to correct for potential background absorbance from compounds or buffer components.
HepG2 cell cytotoxicity assay
The cytotoxicity of the test compounds was evaluated in vitro using the Cell Counting Kit-8 (CCK-8) assay. HepG2 human hepatocellular carcinoma cells were cultured in complete Dulbecco’s modified Eagle medium (DMEM) supplemented with 10% fetal bovine serum (FBS) under standard conditions (37 °C, 5% CO2, humidified atmosphere). Cells were seeded at a density of 1 × 10 in 96-well plates.4 Cells/wells are cultured and incubated for 24 hours to allow attachment. After this period, the medium was replaced with serum-free DMEM containing various concentrations of test compound. A control group without compound treatment was included in each assay. After a 30-min treatment period, 10 μL of CCK-8 reagent was added to each well and incubated for an additional 1–4 h.
Absorbance was measured at 450 nm using a microplate reader. Cell viability was calculated using the following formula:
$${\text{Cell}}\,{\text{Survival rate}}\left( \% \right) = \left[ {\left( {{\text{As}} – {\text{A}}} \right)/\left( {{\text{Ac}} – {\text{A}}} \right)} \right] \times {1}00$$
As: absorbance of treated cells.
Ac: absorbance of control cells (untreated).
A: Absorbance of blank (medium + CCK-8 only).
To control for compound interference with the CCK-8 reagent or absorbance at 450 nm, we included additional wells containing compound + medium + CCK-8 (no cells), and compound + medium (no CCK-8, no cells).


