
Bitcoin (BTC) seemed to promise to return to $100,000 in about a week, but it suddenly reversed late on Sunday, January 18th, and was trading at $93,013 as of press time on Monday.

This reversal, which was also evident across the crypto market as it wiped out around $100 billion from its market capitalization in about 12 hours, was likely driven by a combination of relatively thin liquidity and investor risk-off behavior as the trade war between the US and EU flared up again.
Although political and economic developments both suggest further price changes are to come, advanced machine learning algorithms consulted by Finvold on Monday, January 19, appear to estimate that Bitcoin’s price level will remain stable until the end of the month.
Bitcoin AI price prediction
After analyzing six BTC technical indicators, Finvold’s artificial intelligence (AI) prediction platform estimated that, on average, the world’s top cryptocurrency would rise by just 1.6% by January 31, rising to $94,500 from its price of $93,013 at press time.

Claude Opus 4.1 has set a Bitcoin price target of $97,501, indicating a 4.82% upside on the horizon, proving to be the most bullish of the models included in the prediction system. Conversely, ChatGPT-4o was the most bearish, predicting a decline of 0.55% to $92,500 by January 31, 2026.
Technical indicators of Bitcoin price
Bitcoin’s overall price performance from 2026 onwards begins, and common technical indicators can explain conservative machine learning predictions. Specifically, BTC is trading with significant volatility, with the cryptocurrency already experiencing two significant gains and two major corrections within three weeks.
The technical side is similarly uncertain, although slightly bearish. For example, Bitcoin is well above its 50-day moving average (MA), but more than $10,000 below its 200-day moving average.
The slope of the Moving Average Convergence Divergence (MACD) indicates a weakening of the uptrend and therefore indicates a stronger bearish turn.
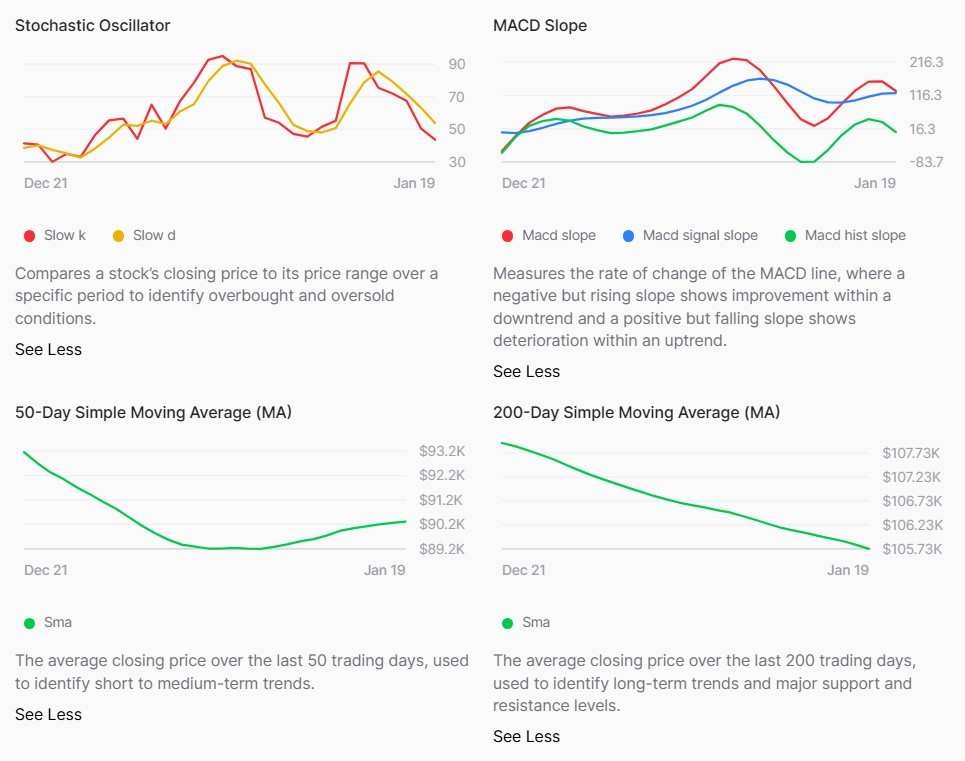
Still, BTC’s Relative Strength Index (RSI) shows that nothing is written in the stars by January 19th as Bitcoin looks neither overbought nor oversold.
Indeed, such a reading drives home the point that the recent dramatic price movements were primarily driven by external events, namely escalating tensions over President Donald Trump’s desired annexation of Greenland.
Featured image via Shutterstock