Double-drum resonator and setup for reservoir computing
The microelectromechanical system used to perform reservoir computing in this work is a double-drum resonator, consisting of two suspended membrane electromechanical resonators, as shown in Fig. 1a–c. A suspended aluminum (Al) membrane serves as a capacitively coupled top gate to the underlying silicon nitride (SiN) drum microelectromechanical resonator33,34. In order to excite mechanical vibrations, electrostatic forces are generated by applying a combination of a DC voltage \({V}_{{dc}}\) and an AC voltage \({V}_{{ac}}\) at a drive frequency \({\Omega }_{d}\) close to the mechanical resonance frequency \({\Omega }_{m}\) of the target mechanical resonator. We exploit the microwave optomechanical interferometry to simultaneously readout the vibrations of both drums, as shown in Fig. 1e. Microwave photons at a frequency ωc= 6 GHz are shined to the double-drum resonator through a 50 Ω transmission line. The reflected microwave signal, carrying information of the mechanical vibrations at frequency ωc+Ωd, is readout by using a lock- in amplifier after frequency down-conversion33. Mechanical mode vibrations are therefore measured in volts in our experiment. Using this readout scheme, the double-drum resonator is initially characterized in its linear operating regime by applying probe tones around \({\Omega }_{m}\) with small AC amplitudes Vd, as shown in Fig. 1d–f. The SiN drum has a resonance frequency of \({\Omega }_{{SiN}}/(2\pi )\approx 12.265\) MHz and a quality factor of QSiN ≈ 1.3 × 10⁴. The Al drum resonates at the frequency \({\Omega }_{{Al}}/(2\pi )\approx 6.13\) MHz with a quality factor QAl ≈ 237. All measurements are carried out at room temperature and under vacuum conditions, ≈6 × 10⁻⁶ mbar.

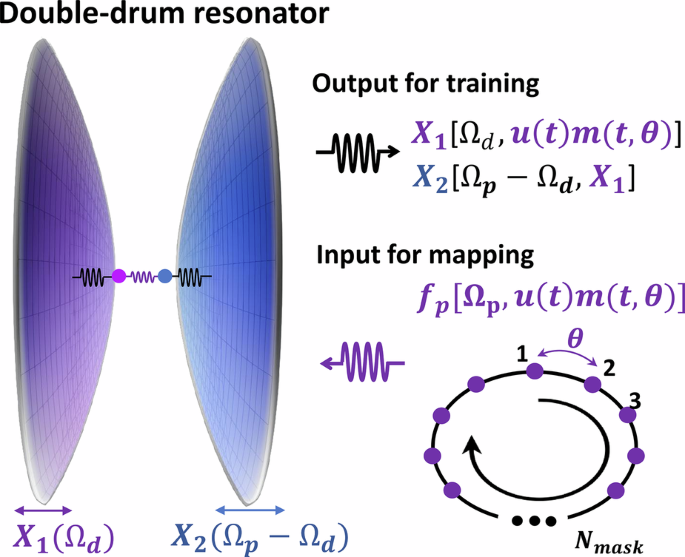
a Optical image of the Al drum resonator which is suspended over the SiN circular drum by the means of 4 support feet. b Optical image of the bottom SiN membrane resonator, covered with an Al thin film. There is no physical connection between the two drums. c Cross sectional view of the electromechanical system. d, f The mechanical responses of the SiN and Al drum resonators are measured under a DC bias of Vdc = 4 V, with AC drive of Vd = 6 mV and 80 mV, respectively, each attenuated by 20 dB. The red lines represent the Lorentz fitting result. e Schematic diagram of the measurement setup. The mechanical displacement is read out using a lock-in amplifier via microwave optomechanical interferometry. The output of the FPGA is used to modulate the pump signal through a multiplier
The reservoir used for computing is constructed from virtual nodes based on a single double-drum resonator acting as the physical node. The creation of virtual nodes is inspired by the conventional time domain multiplexing method implemented in previous works7,19. A standard time-delay loop is implemented using a field-programmable gate array (FPGA), which adds a time delay \(\tau\) to the detected mechanical vibration \(x\left(t\right)\) from the output of the nonlinear element and feeds it back to the input of the resonator in the form of driving forces. The virtual nodes are created by mapping a predefined mask \(m\left(t\right)\) onto the input data u(t). The masked input is then multiplexed with the delayed output of the physical element, x(t–τ), and combined through a multiplier to generate additional modulations on the driving forces, acting on the double-drum resonator.
Nonlinear behavior generated by sideband pumping in phonon-cavity electromechanics
The key concept of phonon-cavity electromechanics is to manipulate coherent energy transfer between two coupled mechanical vibration modes, Ω1 and Ω2, by selecting the mode having the higher resonance frequency (Ω1 > Ω2) and pumping it at its sideband Ω1 ± Ω231,32,34,36. It inherits rich physics from optomechanics, enabling cooling of mechanical vibration modes, amplification of phonon occupancy, and the creation of controllable interference effects37. In this double-drum resonator, we choose the SiN drum as the phonon-cavity mode and pump it at its blue sideband, at the frequency \({\Omega }_{p}={\Omega }_{1}+{\Omega }_{2}+\Delta ={\Omega }_{{Al}}+{\Omega }_{{SiN}}+\Delta\). Here the ∆ is defined as small frequency detuning. Additional to the pump tone, a second tone with small amplitudes is introduced to probe one of the mode with a small frequency detuning δ from the resonance, either \({\Omega }_{d}\approx {\Omega }_{1}+\delta\) or Ωd ≈ Ω2+ δ, placing the double-drum under a two-tone driving scheme, as shown in Fig. 2a, b. Because of frequency mixing effects, the probe and pump tones generate vibration phonons in the unprobed mode, as indicated by the process < 1 >. These phonons are subsequently projected back onto the probed mode by the pump, where they interfere with the probe tone, as marked by the process < 2 >.

a The phonon-cavity SiN drum and b the Al membrane resonator, respectively. c The measured mechanical responses as a function of the pump amplitude. The background contribution has been subtracted using the measured minimum amplitude as a reference. The black (red) curve is measured by probing Al (SiN) drum at Ωd/(2π) = 6.12 MHz (=12.25 MHz) with amplitude Vd = 80 mV (6 mV) attenuated by 20 dB, with Ωp/(2π) = 18.38 MHz and Vdc = 4 V. d Analytical calculation results of the mechanical amplitude as a function of the pump amplitude in both probing cases, by using experimental parameters. e Schematic of the concept for implementing reservoir computing in coupled drum resonators. Phonons carrying the virtual nodes are generated simultaneously in both vibrating drum modes
The two-tone dynamics of the double-drum resonator are described by the following coupled equations of motion:
$$\begin{array}{c}{\ddot{X}}_{1}+{\gamma }_{1}{\dot{X}}_{1}+{{{\Omega }}}_{1}^{2}{X}_{1}=\frac{{V}_{{ac}}{V}_{{dc}}}{{m}_{1}d}{C}_{g0}\left[1-2\frac{\left({X}_{2}-{X}_{1}\right)}{d}\right]\\ {\ddot{X}}_{2}+{\gamma }_{2}{\dot{X}}_{2}+{{{\Omega }}}_{2}^{2}{X}_{2}=\frac{{V}_{{ac}}{V}_{{dc}}}{{m}_{2}d}{C}_{g0}\left[-1+2\frac{\left({X}_{2}-{X}_{1}\right)}{d}\right]\end{array}$$
(1)
where index 1 and 2 refer to each of the SiN and Al membrane respectively. The \({m}_{\mathrm{1,2}}\) denotes the effective mass of the resonator, d the distance between two drums, \({X}_{\mathrm{1,2}}\) the mechanical displacement, \({C}_{g0}\) coupling capacitance between two drums at X1,2=0, and γ the damping rate. Within the capacitive coupling scheme, the electrostatic force acting on the resonator arises from the term VdcVac∂Cg(x1,2)/∂x1,233. In the two-tone driving scheme, \({V}_{{ac}}\) is given by \({V}_{p}\cos \left({\Omega }_{p}t\right)+{V}_{d}\cos \left({\Omega }_{d}t\right)\). The probed resonator is driven by two forces, one coming from the driving tone \({V}_{d}\cos \left({\Omega }_{d}t\right)\) and the other arising from the pump tone induced term, \({V}_{p}\cos \left({\Omega }_{p}t\right)\cdot {X}_{\mathrm{1,2}},\) in a capacitive coupling scheme. The latter term, referred to as the cavity force34,37, enables the pump-mediated coupling between the two resonators. Therefore, this sideband pumping technique enables coherent energy transfer between two capacitively coupled resonators even when their resonance frequencies are significantly different. In the case of probing the SiN drum resonator, \({\Omega }_{d}={\Omega }_{1}+\delta ={\Omega }_{{SiN}}+\delta\), the displacement of the probed resonator can be obtained by solving Eq. 1. To do so, we rewrite variables in complex form, such as \({X}_{1}\left(t\right)=\frac{{x}_{1}\left(t\right)}{2}{e}^{-i{\Omega }_{d}t}+c.c.\), and \({x}_{1}\) arrives
$${x}_{1}=\frac{{f}_{d}}{2{m}_{1}{{{\Omega }}}_{1}}\frac{1}{\frac{1}{{\chi }_{1}}+{g}^{2}{\chi }_{2}}$$
(2)
$${x}_{2}=\frac{{f}_{p}^{* }}{2{m}_{2}{{{\Omega }}}_{2}}\frac{{x}_{1}}{d}{\chi }_{2}$$
by looking for the solution of \({x}_{1}\) around the probe frequency \({\Omega }_{d}\). Here, \({f}_{d}=\frac{{C}_{g0}{V}_{{dc}}{\mu }_{d}}{d}\) and \({f}_{p}=\frac{{C}_{g0}{V}_{{dc}}{\mu }_{p}}{d}\) are the amplitudes of the probe and pump forces respectively, the parameter \({\mu }_{d}\) and \({\mu }_{p}\) represent the complex amplitude of the probe and pump tone, respectively, and the c.c. denotes the corresponding complex conjugate term. The \({\chi }_{1}=\frac{1}{-\delta -i\frac{{\gamma }_{1}}{2}}\) and \({\chi }_{2}=\frac{1}{\delta -\Delta -i\frac{{\gamma }_{2}}{2}}\) are the mechanical susceptibilities of the drum resonators when probing the SiN phonon-cavity. We define an effective coupling strength induced by the pump tone and the phonon population as, \({g}^{2}=\frac{{\left|{f}_{p}\right|}^{2}}{4{m}_{1}{m}_{2}{d}^{2}{\Omega }_{1}{\Omega }_{2}}\). In the expression of Eq. 2, the \({g}^{2}\) acts to modulate the effective susceptibility of the SiN resonator. The solutions of the coupled motion equations shown in Eq. 2 clearly indicate that the phonons in the unprobed mode, here the \({x}_{2}\), are generated by both the probe and pump tones through frequency conversion between the \({f}_{d}\) and the \({f}_{p}\). The entire derivation process has been reported in our previous work34. The calculation results corresponding to the case of probing the Al drum are provided in the Supporting Information (SI). From the displacement expressions of both drums, x1 and x2, as given in Eq. 2, the blue sideband pump brings nonlinear amplifications of the phonons for the probed mode through creating frequency-dependent constructive interference. Such interference arises from pump-induced coherent phonon cycling between the two coupled modes, and the effective constructive interference windows depend on the frequency detunings δ and \(\Delta\) relative to the mechanical damping rates \({\gamma }_{1}\) and \({\gamma }_{2}\). The pump tone functions as a phonon bus, transferring the energy from one mode to the other, in the coupled resonators.
To take advantage of this pump induced nonlinear behavior for reservoir computing, we exploit the fact that the sideband pump amplitude has an effect on shifting \({\Omega }_{{SiN}}\), so called optical spring effect in optomechanics34,37. More details can be found in SI part. This effect arises from the fact that the sideband pump amplitude modifies the effective susceptibility of the coupled mechanical resonators. It is worth emphasizing that this pump-induced effect on \({\Omega }_{{Al}}\) can be neglected in this double-drum system. Because the Al drum has a relatively large bandwidth (damping rate),\({\gamma }_{{Al}}=2\pi \times 25.9\) kHz, small variations in the resonance frequency are not easily observed. To do so, we set the pump frequency to \({\Omega }_{p}={\Omega }_{{Al}}+{\Omega }_{{SiN}}\), where both resonances \({\Omega }_{{SiN}}\) and \({\Omega }_{{Al}}\) are obtained by measuring mechanical responses at the sideband pump amplitude \({V}_{{pc}}\) = 105 mV. We then set the probe tone frequency to either \({\Omega }_{d}={\Omega }_{{SiN}}\) or \({\Omega }_{d}={\Omega }_{{Al}}\) + a few kHz, and measure its amplitude as a function of Vp. The detected probe signals exhibit clear nonlinear constructive interference induced by variations in the pump amplitude, as shown in Fig. 2c. When the pump amplitude deviates far from the calibrated value \({V}_{{pc}}\) = 105 mV, the interference between the probe tone and the phonons projected back from the unprobed mode becomes less effective. This is due to shifts in \({\Omega }_{{SiN}}\), which induce frequency detuning values of the \(\delta\) and \(\Delta\), appearing in the susceptibilities \({\chi }_{1}\) and \({\chi }_{2}\) in Eq. 2. These detuning parameters, relative to the linewidth of the mechanical resonators, define the effective interference window in the frequency space. These interference features have been experimentally measured and modeled in our previous work34. Because the two drum resonators have very different damping rates, the pump-induced nonlinear behaviors are quite different when probing the cavity mode versus the Al drum. The bandwidth \({\gamma }_{{SiN}}\approx 2\pi \times 944\) Hz is much smaller than the resonance-frequency shift induced by variations in the pump amplitude (see SI). Consequently, when the probe tone is initially biased at \({\Omega }_{{SiN}}\) corresponding to \({V}_{{pc}}\) = 105 mV, both increases and decreases in the pump amplitude can shift \({\Omega }_{{SiN}}\) over a frequency range of 7 kHz, making the probe tone to move out of resonance. However, the probe tone can still be amplified through constructive interference, since this frequency shift lies within \({\gamma }_{{Al}}\). When probing the Al drum, although the probe tone always remains within the bandwidth, clear constructive interference can be observed only when the resonance shift relative to the value calibrated at \({V}_{{pc}}\) lies within \({\gamma }_{{SiN}}\). We also noticed that the detected amplitudes of the Al drum exhibited small fluctuations for \({V}_{p} <\) 75 mV. It may be induced by fluctuations in the background noise carried by the pump tone. Figure 2d presents the calculation results, based on Eq. 2, including the pump induced shift of \({\Omega }_{{SiN}}\), which are consistent with the experimental observations. These results demonstrate that pump amplitude modulation in the two-tone driving scheme provides a controllable way of inducing nonlinear behavior in the probe tone in coupled resonators. In the following part, we exploit this nonlinear dynamics for reservoir computing.
Reservoir computing implementation in the phonon-cavity scheme
In the experiment setting, each input is held for a delay time \(\tau\), during which a random binary mask consisting of \({N}_{{mask}}=400\) random values ranging between 0 and 1 is applied with a sampling period of \(\theta\), yielding \(\tau ={N}_{{mask}}\theta\). The parameter \({N}_{{mask}}\) defines the numbers of the virtual nodes, which correspond to \({N}_{{mask}}\) equidistant points separated in time by \(\theta\). The delay feedback loop provides the reservoir states with fading memory by coupling the current mechanical response \(x\left(t\right)\) to its delayed response \(x\left(t-\tau \right)\), thereby creating a recurrent loop in the virtual neural network. As shown in Fig. 1e, both the masked input \(u\left(t\right)m\left(t\right)\) and the delayed mechanical responses \(x\left(t-\tau \right)\) modulate the pump amplitude by combining the FPGA output with the AC signal through a multiplier. This modulation can be described by expressions of
$${V}_{p}\left(t\right)\propto {V}_{p0}\left[{\alpha }_{1}u\left(t\right)m\left(t\right)+{gl}\cdot {\alpha }_{2}\left[x\left(t-\tau \right)-{x}_{0}\right]+{offset}\right]$$
(3)
The values of the constants \({\alpha }_{1}\), \({\alpha }_{2}\), and \({offset}\) are fixed by programmed MATLAB codes to avoid the saturation of the FPGA card and the multiplier. The \({gl}\) is an amplification factor set by the lock-in amplifier to ensure a sufficient signal-to-noise ratio when the delayed signal is processed in the FPGA. The typical value of the \({gl}\) is ~100 for signals detected from the SiN mode and ~400 for or those from the Al mode. Here, the \({x}_{0}\) denotes the preset offset in the measurement. These values define the modulation range of the pump amplitude and ensure linear operation of the modulation, while enabling the nonlinearity arising from pump-induced interference required for reservoir computing. In the phonon-cavity two-tone scheme, the masked input data \(u\left(t\right)m\left(t,\theta \right)\) are applied to the pump force fp, which transfers the information to the mechanical displacements of the two coupled drum resonators. The virtual nodes are mapped onto both drum vibrating modes via nonlinear dynamics induced by pump-mediated interactions between the two mechanical modes, thereby enriching the system dynamics and introducing an additional physical degree of freedom that provides spatial dimensionality to the reservoir. Figure 2e presents the schematic of this concept. In principle, based on Eq. 1, the displacement of either drum resonator could be used for the training process. However, in our experiment, we chose to read out the probed resonator in order to have a better signal-to-noise ratio.
The parity benchmark
The performance of the system was first evaluated using the parity benchmark, which tests the short-term memory capacity of the reservoir and its ability to perform nonlinear mixing of past input states. This benchmark consists of a sequence of random binary input values u(t), taking either +1 or −1, each held for a duration τ. The target nth order parity benchmark output is computed as follows :
$${P}_{n}\left(t\right)=\mathop{\prod }\limits_{i=0}^{n-1}u\left[t-i\tau \right]$$
(4)
The objective is to train the output weights of the system to provide an output which can be as close as possible to the target output \({P}_{n}\). For \(n > 1\), the parity function is nonlinear separable and the task requires the reservoir to store information about a nonlinear transform of previous inputs19.
Probing the SiN phonon-cavity
We first implement the nonlinear amplification scheme by probing the phonon cavity with a weak probe tone while simultaneously applying a blue-sideband pump, as shown in Fig. 3a. Based on these measurement results and Eq. 3, we select the modulation range of the applied pump force by adjusting the setup parameters \({\alpha }_{1}\), \({\alpha }_{2}\), \({offset}\), and \({V}_{p0}\). This enables us to perform separate reservoir-computing measurements under different nonlinear operating regimes. The M1 is the window characterized by a relatively linear variation of the response as a function of the pumping force, M2 is the whole curve with all the linear and nonlinear profiles, M3 is where the nonlinear amplification occurs due to the constructive interferences. The M4 corresponds to a combination of the amplified response and a subsequent drop induced by the \({\Omega }_{{SiN}}\) shifting out of the effective interference window.

a The detected mechanical displacement of the probed SiN membrane as a function of the amplitude of the blue pump signal. The curve is divided into 4 modulation windows M1, M2, M3, and M4 showcasing different profile variations depending on the interval of the blue pump voltage. b Comparison between the predicted output by our reservoir computing scheme (black lines) and the target ideal output of the parity benchmark (red lines) for the first 7 orders of the parity benchmark in the case of the modulation window M4. c Success rates obtained for the first 4 orders of the parity benchmark corresponding to each of the 4 modulation windows
Figure 3b shows one example of the comparison between the target values Pn(t) and the predicted values by the neural network, which are obtained in the modulation window M4, with \(\theta =100\) μs and a period of \(\tau ={N}_{{mask}}\theta\) = 40 ms. We set the constants \({\alpha }_{1}\), \({\alpha }_{2}\) and \({offset}\) to 0.55, 0.34, and 0.69, respectively, which are obtained from an optimization process designed to achieve the best success rates while avoiding saturation of the FPGA card. The success rates show near-perfect results for the first-order \({P}_{1}\) to the third-order \({P}_{3}\) of the parity benchmark, then the curve becomes noisier for the \({P}_{7}\). This decrease in the success rate can be attributed to the lack of higher memory capacity in our device.
Figure 3c presents the reservoir computing results for the different modulation windows described above. For the modulation windows of M2 and M3, the success rates decrease rapidly after P2, dropping below 70%. The best results are obtained for M4 where the characterization curve is strongly nonlinear and where the influence of the interferences are the most dominant. Consequently, the M3 modulation window yields the second-best performance due to its nonlinear response profile. However, as for the M1 window, very poor results are achieved reaching approximately 50 % starting from P2. This is due to the absence of nonlinearity in this modulation window and low signal to noise ratio. Lastly, the window M2 in which the force is modulated between 0.5 mV and 175 mV shows also poor results reaching around 60 % at the second-order. In this modulation range, the linear plateau spans a much wider interval than the nonlinear region, reducing the likelihood that the modulated pump amplitude enters the Vp range that generates nonlinear behavior. Consequently, the success rates decrease rapidly, indicating poor reservoir computing performance for this pump tone modulation window.
Probing the Al drum resonator
We use the same probing method described above for the phonon cavity to obtain the nonlinear amplification curve of the probe tone around the ΩAl, as shown in Fig. 4a. This curve was subdivided into 3 different modulation windows: M1 marked by a linear plateau fluctuating around a minimum value of 0.2 mV, M2 where the curve exhibits a nonlinear amplification up to a maximum of 0.24 mV accompanied by a fast drop and M3 that combines the M2 window with the sudden jump to a displacement value of 0.34 mV. The reservoir computing studies with these 3 modulation windows were conducted with values of the force modulation parameters α1, α2, and offset, respectively 0.56, 0.33, and 0.71, in order to have the best success rate. Promising success rates were obtained in the cases of the windows M2 and M3 due to the nonlinear variation of the characterization curve in each window. Near perfect results were obtained for both P1 and P2 in both cases and then it decreases slowly to reach around 70% for P4. As for M1, the success rates deteriorated quickly reaching an unsatisfactory 50% starting from the second-order P2 of the parity benchmark due to the absence of nonlinear variations within this modulation range of the pump force.

a The detected mechanical displacements of the probed Al membrane as a function of the variation of the amplitude of the blue pump signal. The curve is divided into three modulation windows of the pump amplitudes the M1, M2, and M3 where the detected probe tone exhibits different variations. b Comparison between the predicted output by our reservoir computing scheme (black lines) and the target ideal output of the parity benchmark (red lines) for the first 7 orders of the parity benchmark in the case of the modulation window M3 shown in (a). c Success rates for the first four orders of the parity benchmark (from P1 to P4) for the three different modulation windows. d The values of the obtained NMSE in the case of testing NARMA2 and NARMA10 tasks, corresponding to each pump force modulation window shown in (a)
Short-term memory capacity
Short-term memory is the ability of a system to temporarily maintain a small amount of external input information in a transient state over a short duration38. Here, we evaluate the short-term memory capacity by calculating the square of the correlation coefficient between the predicted output \(y\) and the target output \({y}_{{target},n}\):
$${r}_{{corr}}^{2}\left(n\right)=\frac{{{Cov}\left(y,{y}_{{target},n}\right)}^{2}}{{Var}(y)\times {Var}({y}_{{target},n})}$$
(5)
Here, \({Cov}\), and \({Var}\) are the covariance and variance, respectively, and n corresponds to the order of the parity benchmark. The value of the memory capacity (MC) can be obtained by applying the following summation38,39:
$${MC}=\mathop{\sum }\limits_{n=1}^{{n}_{max}}{r}_{{corr}}^{2}(n)$$
(6)
The measured results from the parity benchmark tests in both the Duffing and the double-tone schemes are used to evaluate the MC, with \({n}_{\max }\) = 7. Figure 5a, b shows the evaluation results for the double-tone scheme when the SiN drum is probed and the phonon cavity is pumped with different amplitude modulation windows, as described in Fig. 3a. The optimal MC obtained is linked to M4 (MC = 3.345), followed by M3 (MC = 2.011), M2 (MC = 1.009) and lastly M1 (MC = 0.58). These results are in agreement with our previous analysis, indicating that enhanced short-term memory performance occurs in the more nonlinear modulation regime induced by pump-mediated phonon interference. Furthermore, an analysis of the dependence of the MC on the sampling period \(\theta\), which is correlated to the damping rate of the SiN resonator (\({\gamma }_{{SiN}}\)), is presented in Fig. 5c. The corresponding modulation windows are chosen as M4 in order to maximize the effect of coupling via phonon interferences. The measurements show that the MC is highly sensitive to the values of \(\theta\) and \({\gamma }_{1}\). The MC increases while increasing \(\theta\) from 32 to 100 μs indicating successful reservoir computing predictions due to the high coupling between the virtual neurons of the reservoir. However, the effect of short-term memory then decreased as to reach approximately 1 for \(\theta\) = 200 μs. On this timescale, the virtual nodes begin to experience a weakened transient regime as \(\theta\)= 200 μs approaches half of the mechanical damping time, leading to reduced coupling between virtual nodes and a deterioration of the short-term memory capacity.

a Square of the correlation coefficients for the first seven orders of the parity benchmark task, corresponding to different pump modulation window as shown in Fig. 3a; b The corresponding memory capacity; c Memory capacity as a function of the sampling period θ and the damping rate γSiN; d Optimized memory capacity obtained in the three physical regimes investigated in this work: Duffing nonlinearity and the two blue-sideband pumping configurations
The NARMA benchmark
The NARMA benchmark is widely used to evaluate nonlinear processing and fading memory in reservoir computing systems. The key feature of the NARMA benchmark is that the current output is generated through a nonlinear combination of many past inputs and outputs. As a result, it requires the reservoir that combines nonlinear processing with long fading memory40. A generalized version of its input-output relationship for this benchmark is given by:
$${\hat{y}}_{n}\left(k+1\right)=0.3{\hat{y}}_{n}\left(k\right)+0.05{\hat{y}}_{n}\left(k\right)\mathop{\sum }\limits_{i=0}^{n-1}{\hat{y}}_{n}\left(k-i\right)+1.5u\left(k\right)u\left(k-n+1\right)+0.1$$
(7)
where n is a time-lag parameter, \(k=\frac{t}{\tau }\) is the timestep. The dimension of the input and output vectors corresponds to a total of N data divided between \({N}_{{tr}}\) for the training phase and \({N}_{{tst}}\) that are utilized to test and evaluate the performance of the reservoir computing experiment. The input u(k) of the system consists of scalar random numbers, drawn from a uniform distribution over the interval [0, 0.5]. The \({\hat{y}}_{n}\) is the output target. In order to evaluate the performance of the system based on the NARMA benchmark, we compute the normalized mean squared error (NMSE). Assuming that the target output vector is \(\hat{y}\) and the predicted output vector by our reservoir computing is y, we adopt the following definition of the NMSE21,41:
$${MSE}\left({\hat{y}}_{n},{y}_{n}\right)=\frac{1}{{N}_{{tst}}}\mathop{\sum }\limits_{i=1}^{{N}_{{tst}}}{\left({\hat{y}}_{n}\left(i\right)-{y}_{n}(i)\right)}^{2}$$
(8)
$${NMSE}\left({\hat{y}}_{n},{y}_{n}\right)=\frac{{MSE}\left({\hat{y}}_{n},{y}_{n}\right)}{{MSE}\left({\hat{y}}_{n},{mean}({\hat{y}}_{n})\right)}$$
As demonstrated in previous studies on the parity benchmark, the initial step in designing a reservoir computing framework is to find the optimal pump force modulation window. Here, we evaluated the system’s NARMA performance across various modulation windows by probing the Al drum resonator, via a sideband pumping scheme, as presented in Fig. 4a. The resulting measurements for each modulation window are shown in Fig. 4d. The optimal NMSE values were achieved at the modulation window M3, coinciding with the nonlinear jump where phonon interference effects become dominant. This observation is consistent with our previous parity benchmark results, indicating that more complex nonlinear behavior benefits for mapping the input into higher-dimensional nonlinear spaces, thereby leading to the improved computing performance.
By selecting an optimal modulation window that maximizes the system’s nonlinear response, we evaluated various modulation schemes using the NARMA benchmark. The first approach leverages the Duffing nonlinearity, the predominant nonlinear characteristic of microelectromechanical systems, which has been successfully employed for reservoir computing in several prior studies19,42. In our double-drum architecture, we exploit the Duffing properties of the SiN drum resonator. More details can be found in the SI part. Due to its circular geometry, the drum design yields a higher nonlinearity coefficient than conventional doubly-clamped beams25,43. The second and third methods are based on sideband pumping, which induces nonlinear phonon-transfer dynamics between two coupled vibrational modes, while probing the SiN phonon cavity and the Al resonator, respectively. The experimental findings are presented in Fig. 6 and details regarding the training and testing parameters can be found in Table 1. In the case of Duffing nonlinearity (Fig. 6a), the NMSE increases gradually from 0.2 and converges to approximately 0.6 at the tenth-order NARMA benchmark. The same trend is observed in the sideband pumping experiment while probing SiN (Fig. 6b) and Al drums (Fig. 6c). It is noticeable that the NMSE increases slightly while probing the SiN drum as it converges to approximately 0.7 and it reaches 0.8 for the NARMA10 in the case of probing the Al drum.

a Duffing nonlinearity, and blue sideband pumping the phonon-cavity while (b) Probing the SiN drum (c) Probing the Al drum
We compare the performance of this MHz-range double-drum resonator with previously reported reservoir computing implementations using single MEMS resonators operating at kHz frequencies. For the parity benchmark, the success rates achieved in this double-drum resonator with the sideband pumping approach are slightly lower than those obtained using the Duffing nonlinearity alone. These results are comparable to those reported for MEMS accelerometer based reservoirs40, but remain below the performance achieved with doubly clamped beam MEMS implementations19. Regarding the NARMA benchmark, our NMSE results do not yet match the good performance of the kHz range MEMS, for instance, without delay loops or mask functions21,22,42. It should be noted that operation of mechanical resonators in the MHz frequency regime inherently could imposes stricter constraints on fading memory compared to kHz MEMS reservoirs when sufficiently high quality factors Q are not achieved, which naturally affects performance on long-memory benchmarks such as NARMA. The fading memory of a mechanical reservoir relies on its decay time T = 2Q/Ωm. While operation in the MHz regime enables faster processing speeds, sufficiently high Q values are required in order to maintain adequate memory capacity22. For example, MEMS reservoirs operating at Ωm/(2π) in a few hundreds of kHz range can naturally exhibit relatively long decay time T ∼ 100 µs with Q ≈ 100. An MHz resonator typically requires to have Q > 103 for having a comparable level of memory capacity. In addition, the lower value of the Q leads to increased effective noise due to the enlarged bandwidth, resulting in a reduced signal-to-noise ratio and weaker effective transduction between the driving force and mechanical displacement. In our experiment, the remaining performance gap is therefore primarily attributed to the limited memory depth and the reduced signal-to-noise ratio associated with the fast-decaying Al drum mode, which degrades the overall reservoir computing performance of the double-drum system. To address these limitations, further optimization of both device design and training strategies is required. On the device side, the mechanical properties of the top Al drum can be improved through nanofabrication optimization, such as reducing clamping losses through engineering the clamping surface (for instance, soft-clamping design) or increasing intrinsic stress by changing the Al deposition speed or thickness to enhance the quality factor. These improvements are expected to suppress noise and reduce the required driving strength in the two-tone sideband pumping scheme. On the algorithmic side, performance may be further enhanced by optimizing post-processing strategies or exploring alternative training approaches to extend the effective memory capacity21,44.


