Our dataset consists of conversations categorized under “Health and Fitness.” After applying the classifier from Step 1 (described in Methods) and excluding the two categories that were not further analyzed (“Not Healthy” and “Other Health/Fitness”), the sample includes: N = 617,827 conversations across the remaining intent categories. Of these, 99.1% have known platform value and are included in the mobile vs. desktop analysis. 99.6% have valid timestamps and are included in the time analysis. A complete description of the categories is provided in Table 1.
Boundaries between general information and personal health questions
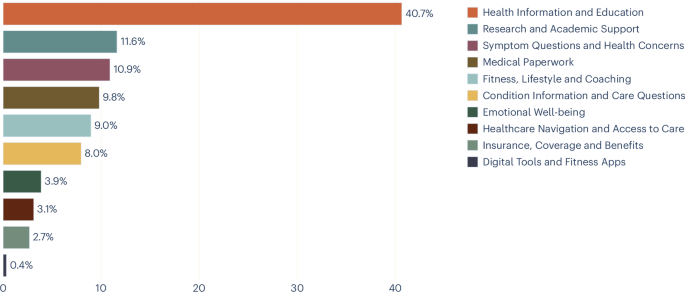
Figure 1 shows the distribution of conversations across health intentions. The largest category, “health information and education,” accounted for 40.8% of conversations, with a 95% confidence interval (CI) of 40.7 to 40.9. This category collects non-personalized queries such as how medications work, causes of conditions, and general nutritional information. Its size is consistent with research showing that information seeking remains the primary means of online health engagement.3. However, some queries framed in general terms may reflect underlying personal concerns, and the actual proportion of individuals’ health preferences may be higher than the taxonomy suggests. The topic clusters (Extended Data Table 1) show that many queries are about specific treatments or conditions rather than general health education, further supporting the interpretation that users may be seeking general information as a step toward personal decision-making.

Health intent usage distribution (percentage of conversations).
Devices as signals of intent
Figure 2 shows how the proportion of all conversations on desktop and mobile changes throughout the day. The former is more common during the day, and the latter is more common at night. This pattern reflects everyday life. During work or school hours, users have access to a desktop device and may prefer it for longer or more complex tasks, but in the evenings and evenings, when people are away from their desks, their primary device for health inquiries is their phone.

Average percentage of health conversations on mobile and desktop throughout the day.
Figure 3 compares the distribution of intents across mobile and desktop. “Digital tools and fitness apps” was excluded from platform and time analysis after manual review found that many conversations in this category were misclassified as health-related when users sought technical support for wearable devices. The distribution of intents varies widely between platforms (χ2(8, N = 612,330) = 73,981.6, P < 0.001). Usage patterns vary widely across devices, with “health information and education” both at nearly 40%. The most obvious difference is between personal and professional intentions. On mobile, “symptom questions and health concerns” accounted for 15.9% of conversations, 95% CI 15.8 to 16.0, whereas on desktop, it accounted for 6.9%, 95% CI 6.8 to 7.0, and “emotional well-being” was 5.1%, 95% CI 5.0 to 5.1. 3.0%, 95% CI 2.9 to 3.0. Conversely, “research and academic support” was 16.9%, 95% CI 16.8 to 17.1 on desktop, 5.3%, 95% CI 5.2 to 5.3 on mobile, and “medical documentation” was 15.7%, 95% CI 15.6 to 15.8, vs. 2.7%, 95% CI. 2.7-2.8.

Percentage of conversations per intent on mobile (solid color) and desktop (striped overlay).
Extended Data Diagrams Figures 1 and 2 show a breakdown of intents by hour of the day, with the top four highlighted. From Figure 1, we would expect “Health Information and Education” to be dominant on both platforms, but its share decreases during working hours as “Research and Academic Support” and “Medical Administration” increase on the desktop. This suggests that using Copilot on the desktop is often adjacent to other activities such as paper writing, research, or administrative work, tasks that typically require accessing other documents and files at the same time as talking. “Medical administration” peaks during normal working hours, while “research and academic support” increases steadily throughout the day, especially after work and school hours when researchers and students work on their projects. More broadly, the desktop pattern may reflect workflows that rely on multiple windows and reference materials that are cumbersome to manage on mobile devices.
On mobile, the second most common purpose is “Symptom questions and health concerns,” followed by symptoms and fitness questions. This is consistent with mobile devices being used primarily for personal health inquiries rather than work-related tasks. In this case, the bottom five topics are independent of the top four and have low percentages throughout the day.
Looking at the changes throughout the day compared to the morning (again excluding “digital tools and fitness apps” mentioned above), the distinction between types of intentions becomes clearer (Figure 4), with more personal intentions (e.g. questions about physical condition and mental health) increasing in the evening and night, and more academic intentions (e.g. research and writing) decreasing. This pattern is particularly pronounced for “mental well-being,” whose proportion increases by more than half from 3.3%, 95% CI 3.3-3.4 in the morning (6:00-12:00) to 5.2%, 95% CI 5.0-5.4 in the evening (00:00-6:00) (χ2(twenty three, N = 613,026) = 903.3, P < 0.001). Similarly, “questions about symptoms and health concerns” increases from 10.6%, 95% CI 10.4-10.7 in the morning to 13.4%, 95% CI 13.1-13.8 at night (χ2(twenty three, N = 613,026) = 1,445.8, P < 0.001).

Temporal change in intent usage compared to morning. of y The axis shows the percentage of the category in the morning. (Morning percentage is 0, if it increases +, if it decreases -) The top graph shows intents that increase throughout the day, and the bottom graph shows intents that decrease.
Conversational AI as a health partner
We also investigated who the health queries were about using the following subsample (Figure 5). n = 2,165 conversations extracted from the main dataset and annotated about the person the query pertains to (a small number of conversations about pets and animals were excluded). This subsample consists of three individual health intentions: “Symptom questions and health concerns,” “Condition information and care questions,” and “Emotional well-being.” In any category, most questions are asked on your behalf. However, for both condition information and symptom questions, one in seven conversations is conducted on behalf of someone else, such as a child, elderly parent, or partner. For “Symptom questions and health concerns,” 14.5%, 95% CI 12.4 to 16.8, concerned dependents. 14.9%, 95% CI 12.6 to 17.6 for “condition information and care questions”; On the other hand, it was 7.6% for “emotional well-being”, 95% CI 5.4 to 10.5, and related to dependence.

Percentage of conversations related to three intents (symptom questions, condition information, and mental health) related to users, dependents, other users, or unknown users.
Extended Data Table 1 shows the five most common topic clusters for the six health concerns faced by consumers, along with the percentages within the categories. The remaining categories (coverage and benefits, research and academic support, medical documentation, digital tools and fitness apps) primarily reflect professional or administrative use cases and were excluded from the topic analysis by design. The clusters revealed that even the broadest category, “health information and education,” was dominated by questions about specific treatments or conditions rather than abstract health knowledge, with narrower individual intentions clearly centered around a few core needs.


