
In this special report, we introduce small area estimation (SAE) as a modern approach to producing reliable stand-level forest inventory information.
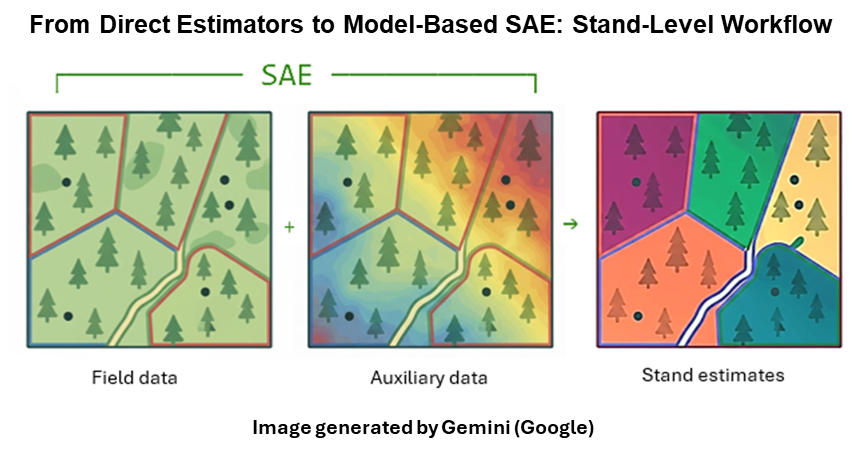
Small Area Estimation (SAE) is a set of statistical tools that helps estimate what a stand looks like, even when there are very few or no ground measurements of the stand. SAE provides a way to transform scattered plot data and wall-to-wall remote sensing into detailed stand-level information on forest attributes such as tree size and density for managers needing harvest planning, wildlife conservation, and carbon tracking (Figure 1).
Why traditional methods are difficult
In practice, most stands have only one or two sample plots, and many stands are never measured. A few small plots cannot fully capture all the variation in a stand, such as dense patches, gaps, and anomalous microsites. Also, it is not at all practical to measure more plots across all stands. As a result, “direct” estimates based only on field plots are often noisy or unavailable at stand level, which is problematic when precise numbers are required for decisions and regulations.
What small area estimation does
SAE approaches this problem by “borrowing strength” from additional information beyond field plots. Predict stand characteristics in areas with little or no ground data using models that link measured plots to a wide range of supporting data such as satellite imagery, aerial photography, and climate, soil, and topographic maps. Briefly, this method asks: “Given what can be seen from the sky or space and what is known from similar stands with plots, what is the most reasonable estimate for this particular stand?”
Using remote sensing and maps
Modern forest inventories can utilize several free or low-cost data sources, including 3D imagery from NAIP, satellite data from Sentinel-2, and LiDAR-based elevation and canopy products. These sources provide continuous coverage across the landscape, capturing features such as canopy height, green depth, and site conditions that are closely related to tree size and density. By aligning these datasets with the temporal and spatial plot locations, the SAE model learns how remote signals relate to ground measurements and applies that knowledge to all stands.
Pay attention to diameter distribution
The main target of these methods is the “diameter distribution” of the stand, i.e. the spread across the tree trunk sizes, rather than just the average. Knowing how many small, medium, and large trees are present supports growth and yield modeling, wildlife habitat assessment, and wood volume and carbon estimation. SAE models can estimate not only summary measurements (e.g. mean diameter) but also the overall shape of the distribution and the number of stems in different diameter classes, providing a stand-level “tree size profile”.
Make estimates more robust
Real-world data is often messy. Some plots are not measured correctly, some stands are very unusual, and some remote sensing pixels do not match the ground for various reasons. Traditional statistical models can be thrown off by such outliers, leading to biased and unstable estimates, especially when the sample size is already small. Robust SAE methods are designed to reduce the impact of extreme or questionable values, so a few odd stands or plots don't skew the overall picture used for biomass mapping, carbon calculations, or policy reporting.
Add machine learning
The new SAE project combines traditional statistical thinking with machine learning techniques such as tree-based models and neural networks. These algorithms excel at detecting complex, nonlinear relationships and interactions. For example, how a combination of canopy structure, spectral color, topographic location, and climate predict tree size and density. Within the SAE framework, machine learning can generate powerful predictions, but the statistical layer provides a measure of uncertainty and helps keep the model interpretable and consistent with forest research principles.
How this helps at stand level
For stands with a few reliable plots, the SAE method places more emphasis on direct field information and uses models primarily to refine those estimates. When there is only one plot or no plots at all, the model relies more on synthetic predictions from remote sensing and other covariates, effectively filling gaps where traditional methods fail or are too uncertain. This allows managers and organizations to obtain consistent stand-level tree lists and other metrics across their management area, rather than having high-quality information in some places and almost nothing in others.
Practical value of forest management
By combining field plots, remote sensing, robust statistics, and machine learning, SAE can provide more accurate and spatially complete stand-level estimates at lower field costs. This enables better decision-making about harvest schedules, habitat conservation, and compliance with carbon and climate reporting standards across different forest types. As inventories grow larger and budgets tighten, SAE's ability to turn sparse measurements into reliable stand-level forest indicators makes it a particularly promising tool for the future.


