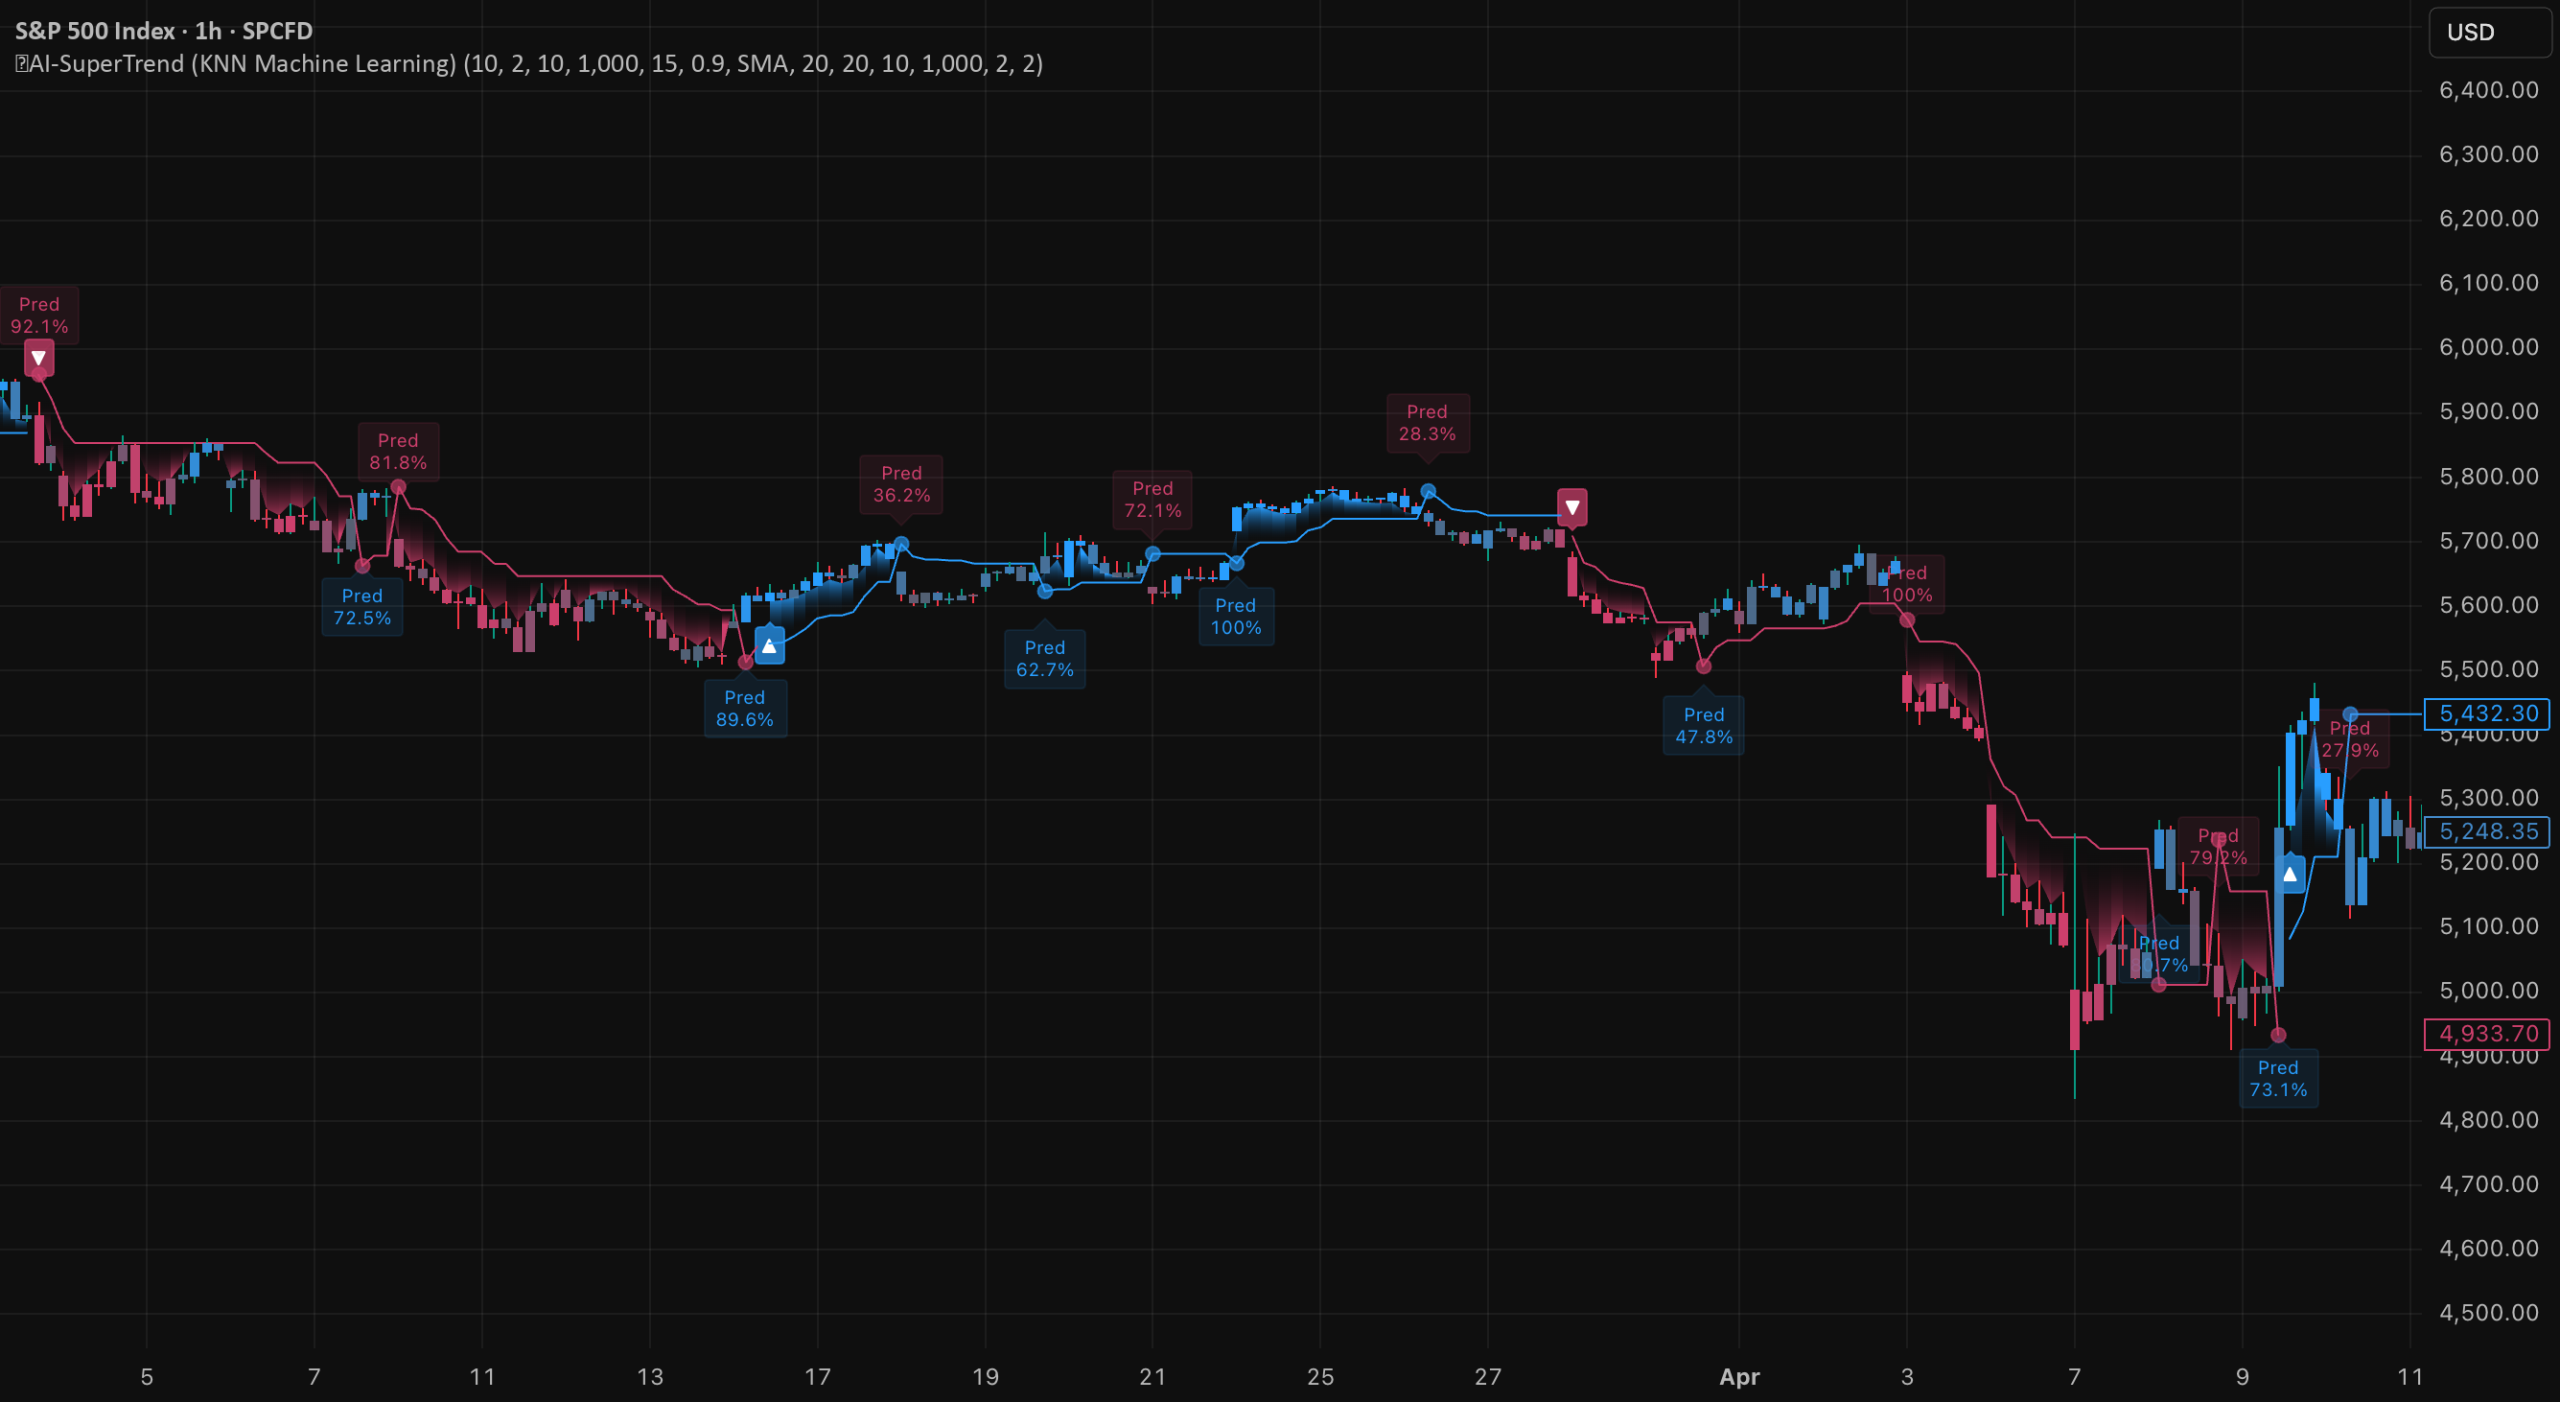
▶️Overview
AI-SuperTrend (KNN Machine Learning) is a trend-tracking indicator that integrates the K-Nearest Neighbors (KNN) classification engine with the classic SuperTrend algorithm. Rather than attempting to “predict” the future of traditionally volatile and noisy financial markets, this tool treats markets as multidimensional states to be estimated.
By continuously sampling historical data, the engine identifies clusters of past states that reflect the present. We then analyze trends in these neighboring countries to estimate the current market’s “true state” and use this statistical consensus to validate the SuperTrend signal and filter out deceptive market noise.
▶️Why choose KNN for financial markets?
In the noisy environment of financial markets, complex parametric models such as support vector machines (SVMs) and deep neural networks often suffer from stability problems. These models often have convergence issues during training or produce output that stagnates around the average due to the low signal-to-noise ratio of financial data. Most importantly, they have a very high tendency to overfit, capturing random price fluctuations as if they were true alpha.
KNN offers distinct advantages through its robustness and adaptability.
Non-parametric properties:
KNN makes no fundamental assumptions about the distribution of data, allowing it to adapt to non-linear and evolving market regimes.
Rolling window learning:
This model utilizes a rolling “learning window” that works naturally with the bar-by-bar execution of Pine scripts. This approach ensures that the engine is always synchronized with the most relevant and up-to-date market structures while maintaining computational efficiency within the platform’s resource constraints.
▶️Core method: KNN and state estimation
1.KNN Engine
K-Nearest Neighbors is a nonparametric “lazy learning” algorithm. Instead of building a static model, we examine the “feature vector” of the current market and search the historical database for the K most similar instances.
Distance metric: Uses Minkowski distance. This can be adjusted by the p parameter. p=1 represents Manhattan distance and p=2 represents Euclidean distance.
Gaussian weighting: Not all neighborhoods are equal. This script applies a weighting kernel so that neighbors closer to the current state are weighted more heavily in the final prediction than neighbors further away.
2. State estimation (Bayesian approach)
The state estimation logic implemented in this script follows the methodology I used in the KNN Machine Learning Momentum Indicator. By applying this approach to the SuperTrend framework, the indicator achieves a higher level of accuracy in trend validation.
Calculating Probability: The probability of a bullish state is calculated as (sum of bullish neighborhood weights) divided by (sum of weights of all K neighbors).
Synergistic Robustness: By combining SuperTrend’s volatility-based bounds and KNN state estimation, the system significantly improves its robustness to market noise. A SuperTrend reversal is only considered a “significant” signal if the AI confirms that the underlying market conditions have truly changed, based on historical probabilities.
Confirm: The signal is triggered only if the estimated probability exceeds a user-defined prediction threshold (such as 0.9 or 90%).
3. Sampling stride (efficiency and diversity)
To balance computational load and data diversity within the limits of Pine Script, the engine utilizes the Stride mechanism.
Computational efficiency: Instead of checking every bar in the lookback window, the script samples data at intervals defined by stride (for example, every 15th bar).
Pattern diversity: By skipping adjacent highly correlated bars, the “learning window” covers a wider range of market structures. This ensures that the KNN engine is aware of different types of volatility and price changes rather than redundant short-term data.
▶️Main features
Multidimensional feature engineering
The AI analyzes a “feature space” consisting of:
RSI Momentum Cluster: Captures momentum over three different time horizons (short, medium, and long term) to detect lead/lag convergence.
MA Deviation: Measures the “stretch” or distance from the average using various moving average types (ZLSMA, HMA, etc.).
PCA Compression: An optional dimensionality reduction toggle that merges correlated features into three principal components. This reduces the “curse of dimensionality” and focuses AI on the most impactful data trends.
▶️Parameter guide
🔲Super trend setting
ATR Length: Lookback period for volatility calculations.
Factor: A multiplier that determines the distance of the SuperTrend line from the price.
🔲Machine learning engine
K-Neighbors (K): Number of historical patterns to compare. A smaller K is more sensitive to recent changes, whereas a larger K is more robust but may lag.
Learning window size: How far back in history the AI ”remembers” and searches for neighborhoods.
Stride: Sampling interval. Stride 15 means the AI learns every 15 bars, increasing the valid history range without hitting the script’s calculation limit.
Prediction threshold: The confidence level (0.1 to 1.0) required to trigger the signal. A value of 0.9 means the AI should be 90% certain based on historical weights.
🔲Feature engineering
Feature MA Type: Select the baseline for deviation (e.g. ZLSMA for zero lag, HMA for velocity).
Normalization window: Z-score normalization lookback. Make sure all features are at the same scale (mean=0, std=1).
Minkowski parameter (p): Controls the distance logic. p=1 is Manhattan, p=2 is Euclid.
Shape Parameter: Controls the sensitivity of Gaussian weighting. Higher values reduce weights more aggressively as distance increases.
▶️Visual analysis
Key Signals (▲/▼): Confident trend changes confirmed by AI. These are only plotted if the SuperTrend direction matches the AI’s predicted direction and its probability exceeds a defined threshold.
Probability label: For each reversal point in SuperTrend, the indicator displays a label indicating the AI’s estimated probability for that trend direction (e.g. “Pred 92%”). This allows you to visually assess the AI’s confidence in SuperTrend flips in real time.
Key signals: Reliable trend changes confirmed by AI.
ST Dot: Standard SuperTrend flips without full AI confirmation.
Dynamic bar color: A gradient representing the real-time AI confidence score.
Blue/Cyan: Bullish confidence.
Red/Pink: High bearish confidence.
Gray: A state of neutrality or indecision.
Disclaimer
Past performance does not guarantee future results. This indicator is a tool for statistical analysis and should be used in conjunction with a complete risk management strategy.