
Image by author
# Experiment introduction
Hyperparameter tuning is often touted as a magic bullet for machine learning. Promises are easy. After a few hours of tweaking some parameters and running a grid search, you can see your model’s performance improve.
But does it actually actually work?

Image by author
We tested this premise on Portuguese student achievement data using four different classifiers and rigorous statistical testing. Our approach utilized nested cross-validation (CV), a robust preprocessing pipeline, and statistical significance testing throughout the nine yards.
result? Performance decreased by 0.0005. that’s right. Tuning actually made the results slightly worse, although the difference was not statistically significant.
However, this is not a failure story. This is more valuable as it shows that the default settings often work very well. Sometimes the best thing to do is know when to stop adjusting and focus on something else.
Want to see the entire experiment? Check out Complete Jupyter notebook with all code and analysis.
# Dataset setup

Image by author
I used a dataset from Strata Scratch “Student Performance Analysis” project. It contains records of 649 students with 30 characteristics covering demographics, family background, social factors, and school-related information. The aim was to predict whether a student would pass the final grade in Portuguese (score of 10 or higher).
A key decision in this setting was to exclude G1 and G2 grades. These are the first and second grades, which have a correlation of 0.83 to 0.92 with the final grade, G3. Including them makes predictions easier and defeats the purpose of the experiment. We wanted to identify what predicts success over previous performance in the same course.
What we used was panda Libraries for loading and preparing data:
# Load and prepare data
df = pd.read_csv('student-por.csv', sep=';')

# Create pass/fail target (grade >= 10)
PASS_THRESHOLD = 10
y = (df['G3'] >= PASS_THRESHOLD).astype(int)

# Exclude G1, G2, G3 to prevent data leakage
features_to_exclude = ['G1', 'G2', 'G3']
X = df.drop(columns=features_to_exclude)
Looking at the class distribution, 100 students failed (15.4%) and 549 students passed (84.6%). Because the data is unbalanced, we optimized for F1 score rather than simple accuracy.
# Classifier evaluation
We selected four classifiers representing different learning approaches.

Image by author
Each model was first run with default parameters and then tuned by a grid search with 5-fold CV.
# Establishing a robust methodology
Many machine learning tutorials omit important validation steps, resulting in superior tuning results. We maintained high standards to ensure that our findings were trustworthy.
Our methodology included:
- No data leakage: All preprocessing is performed in the pipeline and only fits the training data.
- Nested cross-validation: Inner loop was used for hyperparameter tuning and outer loop was used for final evaluation.
- Proper training/test split: We used an 80/20 split with stratification and kept the test set separate until the end (i.e. no “snooping”).
- Statistical validation: applied McNemar’s test To verify whether the performance difference is statistically significant
- Metric selection: We prioritized F1 score for unbalanced classes over accuracy.
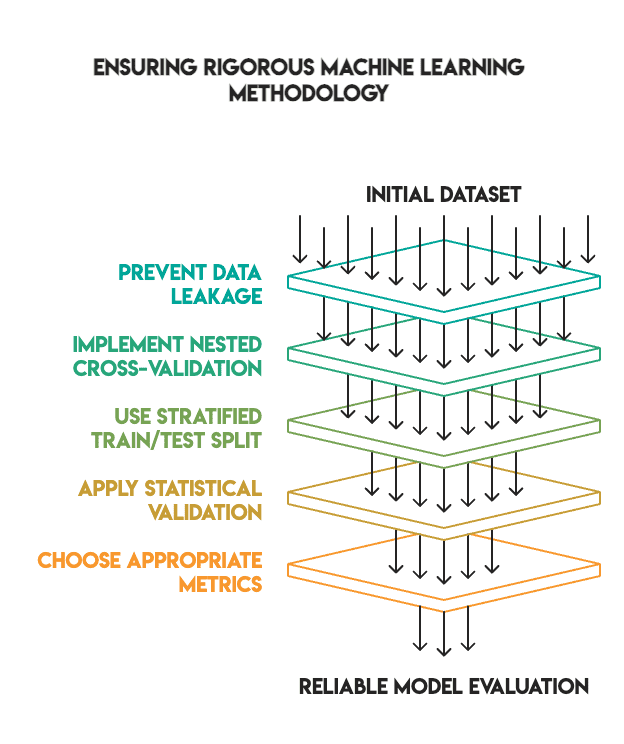
Image by author
The structure of the pipeline is as follows:
# Preprocessing pipeline - fit only on training folds
numeric_transformer = Pipeline([
    ('imputer', SimpleImputer(strategy='median')),
    ('scaler', StandardScaler())
])

categorical_transformer = Pipeline([
    ('imputer', SimpleImputer(strategy='most_frequent')),
    ('onehot', OneHotEncoder(handle_unknown='ignore'))
])

# Combine transformers
from sklearn.compose import ColumnTransformer
preprocessor = ColumnTransformer(transformers=[
    ('num', numeric_transformer, X.select_dtypes(include=['int64', 'float64']).columns),
    ('cat', categorical_transformer, X.select_dtypes(include=['object']).columns)
])

# Full pipeline with model
pipeline = Pipeline([
    ('preprocessor', preprocessor),
    ('classifier', model)
])
# Analysis of results
After completing the adjustment process, the results were amazing.
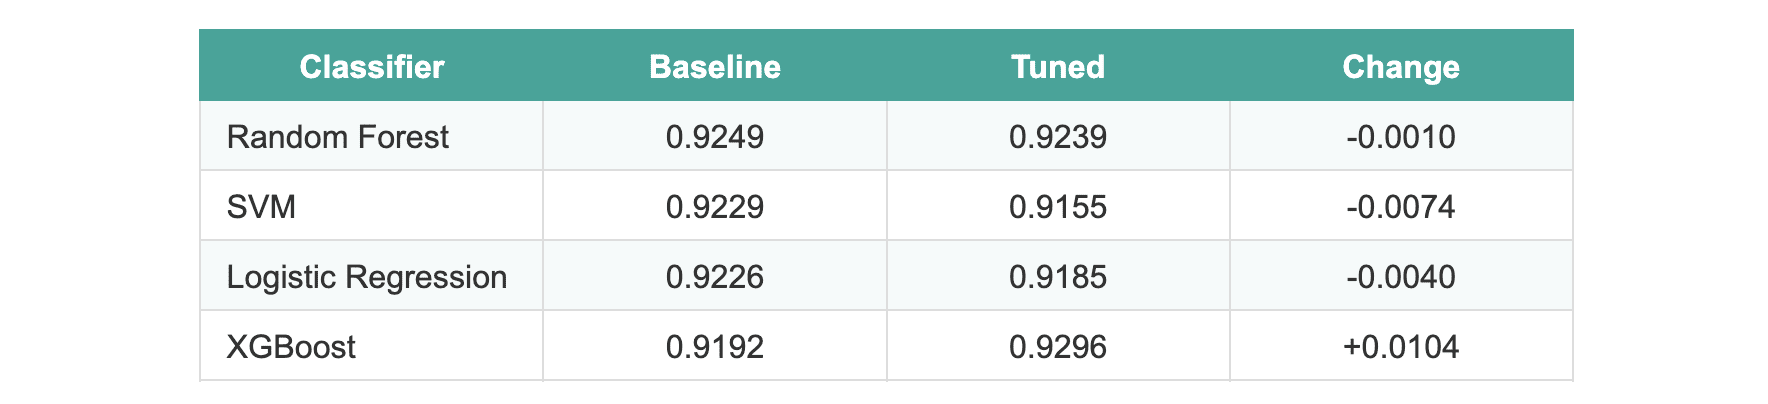
The average improvement for all models was -0.0005.
In fact, the performance of the three models worsened slightly after tuning. XGBoost showed an improvement of about 1% and looked promising until we applied statistical tests. None of the models showed statistically significant differences when evaluated on the holdout test set.
We ran a McNemar test comparing the two best performing models: Random Forest and XGBoost. The p-value is 1.0, which means there is no significant difference between the default version and the adjusted version.
# Explanation of why tuning failed

Image by author
Several factors explain these results.
- Strong defaults. scikit-learn and XGBoost come with highly optimized default parameters. Library maintainers have refined these values over the years to work effectively with a variety of datasets.
- limited signal. After removing G1 and G2 grades (which could cause data leakage), the predictive power of the remaining features decreased. There wasn’t enough signal left to leverage hyperparameter optimization.
- Data set size is small. With only 649 samples split into training folds, there was insufficient data for the grid search to identify truly meaningful patterns. Grid searches require large amounts of data to reliably distinguish between different parameter sets.
- performance limit. Most baseline models already have F1 scores of 92-93%. The scope for improvement is naturally limited unless better features and more data are introduced.
- Rigorous methodology. Eliminating data leakage and leveraging nested CVs eliminates the inflated improvements often seen with inadequate validation.
# learn from results
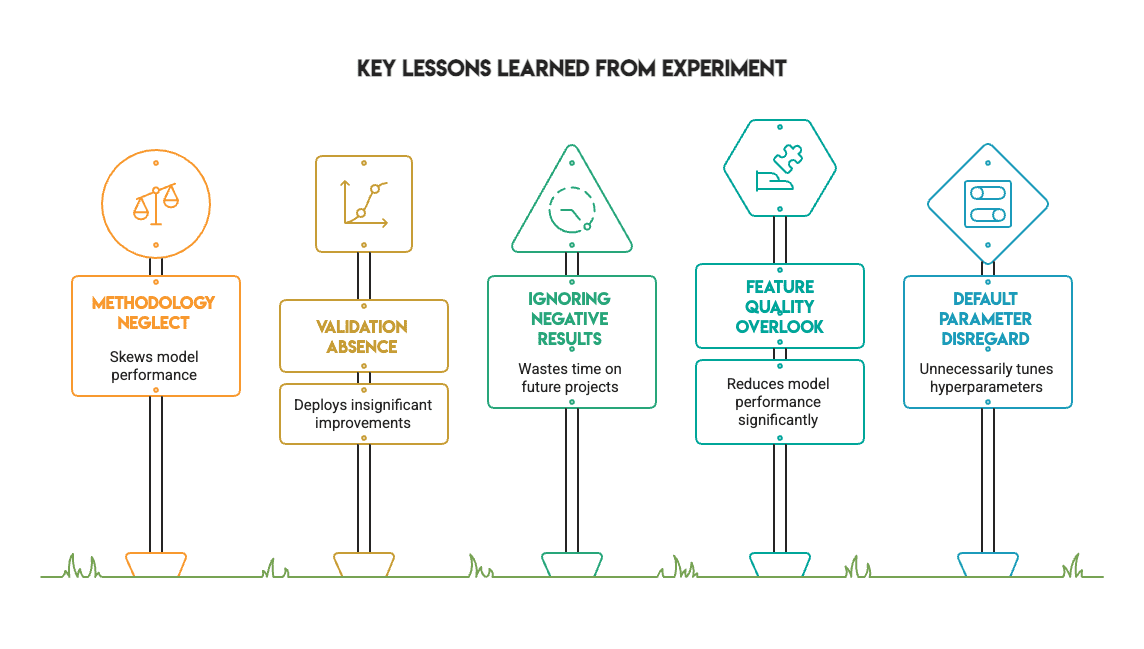
Image by author
This experiment provides several valuable lessons for practitioners.
- Methodology is more important than metrics. Fixing data leaks and using proper validation will change the outcome of your experiment. A great score obtained with improper verification will disappear if the process is handled correctly.
- Statistical validation is essential. Without McNemar’s testing, we may have incorrectly deployed XGBoost based on a nominal 1% improvement. After testing, this turned out to be just noise.
- Negative outcomes have immense value. Not all experiments need to show significant improvement. Even when you know that tuning won’t save you time on future projects, it’s a sign that your workflow is maturing.
- Default hyperparameters are undervalued. For standard datasets, the defaults are often sufficient. Don’t assume you need to adjust all parameters from the beginning.
# Summary of findings
We followed industry best practices, applied statistical validation across four different models, and attempted to improve model performance through thorough hyperparameter tuning.
Results: No statistically significant improvement was observed.

Image by author
This is not a failure. Instead, it represents the kind of honest results that allow you to make better choices in real-world project work. This lets you know when to stop hyperparameter tuning and shift your focus to other important aspects, such as data quality, feature engineering, and collecting additional samples.
Machine learning is not about achieving the highest possible numbers by any means necessary. It’s about building reliable models. That trust comes from the methodological process used to build the model, not from pursuing marginal gains. The most difficult skill in machine learning is knowing when to stop.
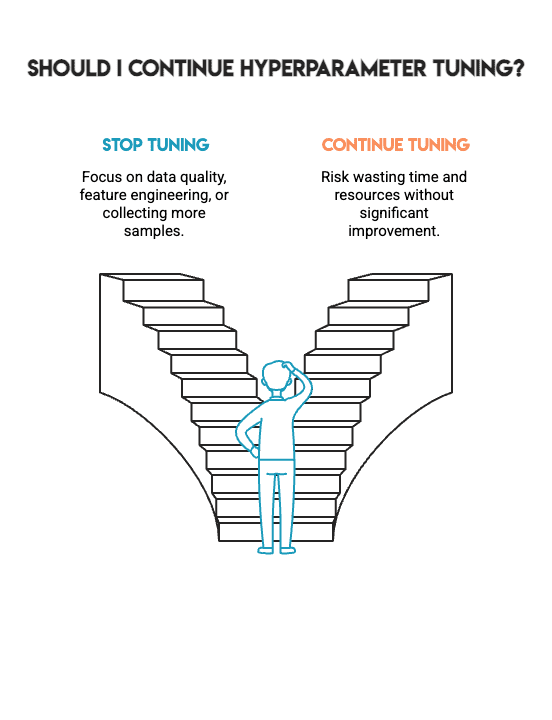
Image by author
Nate Rossidi I am a data scientist and work in product strategy. He is also an adjunct professor teaching analytics and the founder of StrataScratch, a platform that helps data scientists prepare for interviews by providing real interview questions from top companies. Nate writes about the latest trends in the career market, offers interview advice, shares data science projects, and covers all things SQL.