Source of questionnaire items
This study investigates the psychological factors influencing teachers’ continued use of AI tools in primary school English education via a questionnaire survey. The questionnaire consists of four sections: emotions and psychological security, tool performance and usage expectations, trust and anxiety, and perceived risk. Each section is designed around the research variables and covers the psychological factors that influence teachers’ continued use of AI tools. The first section focuses on emotions and psychological security, including psychological security, AI anxiety, and interest. Psychological security evaluates teachers’ emotional stability and confidence in using AI tools. AI anxiety reflects concerns about uncertainty and technical failures, while the interest variable assesses teachers’ attraction to AI tools and their interest in new technologies. The second section addresses tool performance and usage expectations, including effort expectancy, performance expectancy, and satisfaction. Effort expectancy evaluates teachers’ expectations of the ease of use of AI tools, performance expectancy reflects their belief that AI tools can improve teaching effectiveness, and satisfaction measures teachers’ overall satisfaction with AI tools, including performance, ease of use, and their contribution to student learning outcomes. This section explores how teachers’ expectations influence their attitudes toward use and long-term intention to use AI. The third section investigates trust, anxiety, and perceived risk, including AI trust, perceived risk, and AI anxiety. AI trust evaluates teachers’ trust in AI tools, perceived risk reflects concerns about technical failures and data privacy issues, and AI anxiety assesses discomfort when the technology fails to perform as expected. This section investigates how negative emotions and risk perceptions affect teachers’ trust and influence their intention to continue using AI tools. Figure 2 shows the study design, data collection, and analysis process.

The flowchart of study methodology.
Sample
This study used a three-stage stratified sampling method to select samples in Xiamen, China. First, during the school screening stage, based on the annual report on educational technology from the Municipal Education Bureau, we selected two public primary schools with typical artificial intelligence teaching capabilities. A school is in the urban area and has 120 faculty members; School B is in the suburbs and has 80 faculty members. The selection criteria for the sample schools include continuously conducting AI assisted teaching for at least three years and using two or more types of AI teaching tools, which has been verified through a preliminary research checklist. In the teacher stratification stage, the research team stratified 400 eligible frontline English teachers based on two key dimensions. The first dimension is the stratification of teaching experience, which divides teachers into three groups: early career (1–5 years), mid-career (6–15 years), and senior teachers (over 16 years). The second dimension is proficiency in AI technology. Referring to the certification standards of Xiamen Teacher Development Center, teachers are divided into three categories: those holding city level AI training certificates (32%), self-taught masters (41%), and beginners (27%).
Data collection was conducted through the online questionnaire, with a total of 400 questionnaires distributed. In the first stage, 353 questionnaires were collected, with an initial response rate of 88.25%. After strict data cleaning, 18 invalid questionnaires with linear answers or missing values exceeding 20% were excluded, resulting in 335 valid questionnaires with an effective retention rate of 83.75%. The statistical power analysis conducted using G Power 3.1 software showed that at the α = 0.05 level, the statistical power of the equivalent strain (f ²=0.15) in the current sample size detection reached 95%, meeting the research requirements. As shown in Table 1, the questionnaire was designed based on established scales from existing research and adapted to the specific context of this study to ensure the reliability and validity of the measurement tool. This study was conducted in accordance with all relevant guidelines and regulations. The research protocol was approved by the Ethics Committee of Xiamen Institute of Technology Institutional Review Board. All participants provided written informed consent prior to participation, and their privacy and anonymity were strictly protected throughout the study.
Basic information analysis of the questionnaire
The demographic analysis of survey respondents, encompassing gender, age, AI teaching experience, educational background, professional position, and AI tool utilization patterns, demonstrates substantial representativeness. As illustrated in Fig. 3, the gender distribution reveals a predominance of male participants (n = 199, 59%) over female counterparts (n = 136, 41%). Age distribution analysis indicates that the largest cohort comprises educators aged 31–35 years (n = 127, 38%), followed by those aged 25–30 years (n = 96, 29%), suggesting a concentration of relatively experienced teachers within the 30–40 age range. Regarding AI pedagogical experience, the data reveals that 51% of respondents possess over 3 years of experience, while 35% report 1–3 years of experience, and 14% have less than 1 year of experience, indicating substantial AI integration among the teaching workforce. Educational attainment analysis shows that 38% of participants hold bachelor’s degrees, 29% possess master’s degrees, and 18% have obtained Master of Education degrees, reflecting a highly qualified professional cohort. Professional position distribution indicates that classroom teachers (41%) and senior teachers (29%) constitute the majority, while administrative roles (principals and vice-principals) are less represented. In terms of AI technology adoption, Natural Language Processing (NLP) emerges as the most frequently utilized tool (37%), followed by speech recognition (29%), machine translation (16%), and intelligent assessment systems (8%), demonstrating significant technological integration, particularly in language acquisition and student engagement domains. Collectively, the demographic profile reveals a predominantly young, highly educated teaching workforce with substantial AI technology experience, particularly in NLP and speech recognition applications, indicating strong technological proficiency and practical implementation capabilities.

Distribution of basic information.
Exploratory factor analysis
Reliability and validity analysis
Before conducting exploratory factor analysis, we assessed the reliability and validity of the questionnaire variables. According to Table 2, the Cronbach’s Alpha values for all variables exceed 0.7, indicating good internal consistency. Specifically, the Alpha value for the Interest variable is 0.890, the highest, indicating its strong measurement reliability. The Alpha values for Effort Expectancy and Satisfaction are 0.881 and 0.858, respectively, both indicating strong consistency. Other variables, such as Psychological Security, Continuance Intention, Performance Expectancy, and AI Trust, have Alpha values above 0.8, further confirming the questionnaire’s high reliability. Although the Alpha values for Perceived Risk and AI Anxiety are 0.741 and 0.789, respectively—relatively low—they are still within an acceptable range, indicating sufficient reliability. The Kaiser-Meyer-Olkin (KMO) value is another key indicator of data validity. The KMO values for all variables exceed 0.7, indicating that the data are suitable for factor analysis. Specifically, the KMO values for Interest and Satisfaction are 0.883 and 0.865, indicating a good fit. The KMO values for Effort Expectancy and AI Trust are 0.869 and 0.814, also indicating good validity. Although the KMO value for AI Anxiety is 0.704, relatively low, it still meets the requirements for factor analysis, indicating acceptable validity. Overall, the KMO values indicate strong data validity, making the data suitable for factor analysis. The reliability and validity analysis in Table 2 demonstrates that all variables perform well, meeting the conditions for exploratory factor analysis. Therefore, we can proceed with exploratory factor analysis to examine the relationships between variables and determine the underlying factor structure.
Factor number analysis
This study used principal component analysis (PCA) for factor extraction and assessed each factor’s contribution to the total variance. According to Table 3, the eigenvalues of the first nine factors are greater than 1, indicating their significant contributions to explaining the data variance. The first factor has an eigenvalue of 9.525, explaining 24.424% of the total variance, the largest contribution of all factors. The second factor has an eigenvalue of 3.186, explaining 8.168% of the variance, and the third factor has an eigenvalue of 2.725, explaining 6.987%. Together, these three factors account for 39.579% of the total variance. The fourth and fifth factors have eigenvalues of 2.408 and 2.157, explaining 6.175% and 5.531% of the variance, respectively. The first five factors together account for 51.285% of the variance. The sixth to ninth factors have eigenvalues of 1.907, 1.768, 1.375, and 1.032, explaining 4.889%, 4.533%, 3.526%, and 2.646% of the variance, respectively. The first nine factors together account for 66.878% of the variance, capturing most of the key information in the data. After rotation, the first five factors remain dominant, explaining a cumulative 42.227% of the variance. The first three factors explain 26.594% of the variance. The sixth and seventh factors explain 7.050% and 6.281% of the variance, respectively, indicating their significant importance in the data structure. After rotation, the first nine factors explain 66.878% of the variance, revealing the main structure of the data. Therefore, the first nine factors are the most important in this analysis. They effectively represent the overall characteristics of the data and provide a basis for the subsequent path analysis of the structural equation model.
Confirmatory factor analysis
Model fit indices analysis
This study conducted a detailed analysis of various model fit indices to evaluate whether the factor model accurately explained the data structure and demonstrated good fit. Table 4 presents the results of the confirmatory factor analysis, where CMIN and DF are traditional indices for measuring model fit. In this analysis, CMIN is 881.373, DF is 666, and the calculated CMIN/DF ratio is 1.323. According to standard guidelines, the CMIN/DF ratio should be less than 3. A ratio of 1.323 indicates a good model fit, with an appropriate balance between complexity and data fit. Next, the fit indices, such as NFI, RFI, IFI, TLI, CFI, and GFI, are all above or near 0.9. Although NFI and RFI are slightly lower, all other indices exceed 0.9, with IFI, TLI, CFI, and GFI at 0.964, 0.959, 0.963, and 0.959, respectively. This indicates a very good model fit and the ability to accurately explain the data structure. Although NFI and RFI are slightly below 0.9, they remain within an acceptable range, suggesting that the model fit meets basic requirements. Finally, RMSEA is used to assess model error, with lower values indicating a better fit. The RMSEA for this model is 0.031, well below the standard value of 0.08, indicating minimal fitting errors and a good fit, consistent with the actual data distribution. Overall, all major fit indices suggest that the model fits well and effectively explains the relationships between variables, supporting subsequent hypothesis testing and factor analysis. Therefore, we conclude that the model fits well, meets the standards for confirmatory factor analysis, and demonstrates strong explanatory power and reliability.
Convergent validity analysis
The analysis of convergent and discriminant validity is based on the data in Tables 5 and 6. First, the convergent validity analysis in Table 5 shows that the loading factors of all constructs exceed 0.7, indicating a strong association between each construct’s measurement items and the latent variables. The loading factors for Continuance Intention are 0.709, 0.755, 0.744, and 0.736, with a composite reliability (CR) of 0.914 and an AVE of 0.536, meeting the standard and confirming good convergent validity. The loading factors for Satisfaction range from 0.700 to 0.788, with composite reliability of 0.925 and an AVE of 0.546, indicating high convergent validity. Other constructs, such as Psychological Security, Effort Expectancy, Performance Expectancy, AI Trust, AI Anxiety, and Interest, all have loading factors above 0.7, composite reliability greater than 0.8, and AVE generally exceeding 0.5, further confirming their high convergent validity. The discriminant validity analysis in Table 6 shows that the AVE values for all constructs exceed their correlation coefficients with other constructs, verifying the model’s validity. For example, the correlation coefficient between Continuance Intention and Satisfaction is 0.671, which is lower than their respective AVE values (0.536 and 0.546), indicating good discriminant validity between these constructs. Similarly, the correlation coefficient between Psychological Security and Effort Expectancy is 0.632, lower than their respective AVE values (0.545 and 0.602). Other constructs, such as AI Anxiety and Interest, have a correlation coefficient of 0.67, lower than their AVE values (0.560 and 0.602), demonstrating high discriminant validity. Although some correlation coefficients between constructs are high (e.g., the correlation coefficient between AI Trust and Continuance Intention is 0.62), they remain lower than their respective AVE values and do not exceed 0.9, indicating effective distinction and no excessive overlap between constructs. Overall, the convergent and discriminant validity of all constructs meet the standards, confirming that the model has strong measurement validity, with high reliability.
Structural equation model path analysis
This study conducted a comprehensive analysis of the path coefficient test results in Table 7 for the Structural Equation Model (SEM) path analysis. First, the positive effect of AI Anxiety on Psychological Security was supported, with a path coefficient of 0.324, C.R. of 4.369, and a P value less than 0.001. This suggests that higher AI anxiety correlates with stronger psychological security in teachers. The effect of AI Trust on Psychological Security was also supported, with a path coefficient of 0.228, C.R. of 3.531, and a P value less than 0.001. This shows that higher trust in AI correlates with stronger psychological security. Second, the positive effect of Psychological Security on Effort Expectancy was supported, with a path coefficient of 0.200, C.R. of 2.849, and a P value of 0.004. This suggests that psychological security increases teachers’ effort expectancy. Additionally, the effect of Psychological Security on Performance Expectancy was supported, with a path coefficient of 0.326, C.R. = 5.150, and P < 0.001. This indicates a significant positive effect of psychological security on teachers’ performance expectancy. While the effect of Effort Expectancy on Satisfaction did not reach statistical significance (path coefficient = 0.080, C.R. = 1.881, P = 0.060), the effects of Performance Expectancy and Psychological Security on Satisfaction were supported. The path coefficients were 0.369 (C.R. = 6.226, P < 0.001) and 0.244 (C.R. = 4.452, P < 0.001), respectively, indicating significant positive effects on teacher satisfaction. Regarding Continuance Intention, Satisfaction had a significant effect, with a path coefficient of 0.296, C.R. = 4.106, and P < 0.001, showing a positive relationship between satisfaction and the intention to continue using AI tools. The effect of Performance Expectancy on Continuance Intention was not supported (path coefficient = 0.039, C.R. = 0.656, P = 0.512). However, the effect of Effort Expectancy on Continuance Intention was supported, with a path coefficient of 0.218, C.R. = 4.830, and P < 0.001. The effect of Interest on Continuance Intention was also supported, with a path coefficient of 0.192, C.R. = 4.391, and P < 0.001, indicating that interest is a significant factor influencing teachers’ continued use of AI tools. The effect of AI Trust on AI Anxiety was supported, with a path coefficient of 0.268, C.R. = 4.247, and P < 0.001. This indicates that AI trust effectively reduces teachers’ anxiety. In conclusion, the path analysis supports the important roles of psychological security, performance expectancy, effort expectancy, AI trust, and other factors in teachers’ continued use of AI tools (The Scree Plot was shown in the Fig. 4).

Moderating effect analysis
Perceived risk moderating the relationship between effort expectancy and continuance intention
This section explores whether Perceived Risk moderates the relationship between Effort Expectancy and Continuance Intention. Based on the results in Table 8, we analyze the coefficients, standard errors (S.E.), critical ratios (C.R.), and P-values for each path. First, the path coefficient for the constant term is 1.3184, with a standard error of 0.6958, a C.R. of 1.8949, and a P-value of 0.0590. Although the P-value is slightly above 0.05, it is close to the significance threshold, suggesting some statistical significance. Next, the direct effect of Effort Expectancy on Continuance Intention has a path coefficient of 0.1101, a standard error of 0.2073, a C.R. of 0.5314, and a P-value of 0.5955, indicating that the effect is not significant. The influence of effort expectancy on the intention to continue using AI tools is not statistically significant. Then, the direct effect of Perceived Risk on Continuance Intention has a path coefficient of 0.4318, a standard error of 0.1793, a C.R. of 2.4080, and a P-value of 0.0166, suggesting a significant positive effect of Perceived Risk on Continuance Intention. This suggests that higher perceived risk faced by teachers when using AI technology strengthens their intention to continue using it. Finally, the interaction effect of Perceived Risk on the relationship between Effort Expectancy and Continuance Intention has a path coefficient of 0.0345, a standard error of 0.0524, a C.R. of 0.6577, and a P-value of 0.5112. The result shows that this interaction path is not significant, and Perceived Risk does not significantly moderate the relationship between Effort Expectancy and Continuance Intention. Although Perceived Risk has a direct effect on Continuance Intention, it does not significantly alter the relationship between Effort Expectancy and Continuance Intention.
Perceived risk moderating the relationship between performance expectancy and continuance intention
In analyzing the moderating effect of Perceived Risk on the relationship between Performance Expectancy and Continuance Intention, we examined the data in Table 9. First, the path coefficient for the constant term is 4.5153, with a standard error of 1.0871, a C.R. of 4.1535, and a P-value of 0.0000, suggesting the significance of the constant term and the model’s strong baseline effect. The path coefficient for Performance Expectancy on Continuance Intention is -0.7433, with a standard error of 0.2836, a C.R. of -2.6204, and a P-value of 0.0092, indicating a significant negative relationship between Performance Expectancy and Continuance Intention. This suggests that higher performance expectancy regarding AI tools is associated with a lower intention to continue using them. The direct effect of Perceived Risk on Continuance Intention has a path coefficient of -0.4393, a standard error of 0.2840, a C.R. of -1.5469, and a P-value of 0.1228, suggesting that the direct effect of Perceived Risk on Continuance Intention is not significant, despite being negative. Further analysis examined the interaction effect of Perceived Risk on the relationship between Performance Expectancy and Continuance Intention. The interaction term path coefficient is 0.2595, with a standard error of 0.0731, a C.R. of 3.5523, and a P-value of 0.0004, suggesting that Perceived Risk significantly moderates the relationship between Performance Expectancy and Continuance Intention. Particularly under higher perceived risk, the negative impact of Performance Expectancy on Continuance Intention becomes more pronounced. The moderating effect analysis shows that when Perceived Risk is 3.0030, the interaction effect is not significant (P = 0.6387). However, when Perceived Risk is 3.7881 and 4.5731, the interaction effect significantly strengthens, with P-values of 0.0000. Specifically, under higher perceived risk, the negative impact of Performance Expectancy on Continuance Intention intensifies. This may be due to teachers having more doubts when faced with higher technological uncertainty or risks, reducing their intention to continue using AI tools.
Discussion
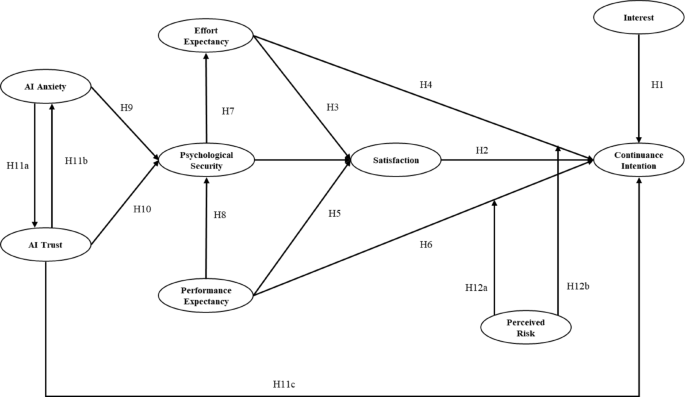
This study examines the impact of several psychological factors on primary school English teachers’ continued use of Artificial Intelligence (AI) technology and validates their roles through Structural Equation Modeling, as shown in Fig. 5. The results align with existing theoretical frameworks and deepen our understanding of emotional and psychological factors in educational technology adoption. First, teachers’ interest, satisfaction, and psychological security are key factors in their continued use of AI tools. Teachers’ interest in and positive attitude toward AI tools are among the primary drivers of their continued use. Interest stimulates teachers’ involvement and curiosity, aligning with the “perceived usefulness” theory by Majumder et al.51. Teachers who believe AI tools improve teaching effectiveness and student outcomes are more likely to use the technology long-term. Teachers’ satisfaction directly influences their intention to continue using AI tools. Satisfaction stems from the actual utility of AI tools in personalized learning, timely feedback, and enhancing teaching effectiveness, aligning with Choudhary & Rane’s (2023) theory on technological satisfaction52. The study also finds that psychological security significantly influences teachers’ continued use of AI tools. When teachers find AI tools easy to operate and stable, their psychological security increases, boosting their reliance on technology. Psychological security helps alleviate anxiety caused by the uncertainty and risks associated with AI technology. This supports Yoon & Galbraith’s (2023) theory on the bidirectional relationship between trust and psychological security53. However, anxiety and perceived risks limit teachers’ intention to use technology. As teachers’ distrust in AI tools and concerns about technical failures and data privacy rise, anxiety increases, influencing their decision to continue using AI tools. The study also confirms the moderating effect of perceived risk on teachers’ technology adoption, particularly when technological uncertainty is high. Research has found that teachers’ risk perception of AI tools exhibits significant stage wise moderating characteristics. This study identified three key risk action intervals: when risk perception is below 2.8 points (5-point scale), its moderating effect on technology adoption is not significant; Within the warning range of 2.8–3.8 points, risk perception significantly enhances the negative effects of performance expectations. For every additional unit of risk perception, teachers’ trust in AI performance decreases by 26%; When the risk exceeds the threshold of 3.8 points, some teachers exhibit risk adaptation behavior, forming a “pressure growth” transformation mechanism. Therefore, for school administrators, it is recommended to establish a dynamic risk response system, including organizing monthly AI application case seminars for low-risk teachers, offering risk management courses including error case analysis for medium risk teachers, and equipping high-risk teachers with dedicated technical consultants and implementing an AI decision tracking system. At the same time, real-time risk dashboards can be set up in the teacher’s work area to dynamically display key indicators such as the accuracy of the AI system and the proportion of manual reviews.

Hypothesized path coefficients.
This study provides empirical support for teachers’ psychological responses and usage intentions regarding Artificial Intelligence (AI) technology through path coefficient and P-value analysis. Higher path coefficients, such as the relationship between psychological security and performance expectancy (path coefficient = 0.326, P < 0.001), indicate a strong positive relationship between these variables. This supports Siagian et al.‘s (2022) views in the Technology Acceptance Model, emphasizing the importance of “perceived ease of use” and “perceived usefulness” in technology adoption54. Enhancing psychological security strengthens teachers’ performance expectancy of AI tools, suggesting that a supportive teaching environment fosters more positive adoption of AI tools. Educational administrators should create an easy-to-use and stable technological environment to improve teachers’ psychological security and usage intentions. On the other hand, relationships with smaller path coefficients, such as the effect of “effort expectancy” on satisfaction (path coefficient = 0.080, P = 0.060), suggest that, although teachers expect AI tools to be easy to use, this factor has a limited impact on satisfaction. This aligns with Haque and Jan’s (2024) theory of “effort expectancy,” which emphasizes that the influence of ease of use on acceptance is just one factor55. Teachers’ satisfaction is also influenced by the actual effectiveness of AI tools, teaching expectations, and psychological factors such as anxiety and trust. Relationships with smaller P-values, such as the relationship between performance expectancy and satisfaction (path coefficient = 0.369, P < 0.001), indicate that performance expectancy significantly impacts teachers’ satisfaction. Teachers’ expectations that AI tools will improve teaching effectiveness and student performance are closely related to their satisfaction and usage intentions, supporting the hypothesis in Ku and Chen’s (2024) Technology Acceptance Model. Educational technology design should focus on enhancing the actual effectiveness of AI tools, particularly in improving teaching quality and student outcomes56. In summary, the analysis of path coefficients and P-values supports the core role of psychological security, performance expectancy, and teacher satisfaction in usage intentions. Educational administrators and technology developers should design AI tools based on these findings and improve teachers’ trust in technology through training, thereby enhancing the effectiveness of AI in education.
This study offers valuable insights for the innovation and development of educational technology. Although several hypotheses were confirmed, some did not receive significant support, prompting us to consider ways to promote AI technology adoption in education. The study shows that teachers’ intention to use AI tools depends not only on ease of use and direct teaching effects but also on psychological security, anxiety, and trust in AI tools. This suggests that improving ease of use or performance alone is insufficient to increase teachers’ acceptance. Educational technology developers should focus on integrating technology with users’ emotional needs. Developers should design personalized and accessible training systems and support platforms to help teachers adapt to technology, offering timely support and psychological counseling during technical failures or unfamiliar operations57. Teachers’ anxiety and lack of trust in AI technology also hinder their usage intention. Technology promotion should aim to reduce teachers’ anxiety and increase their trust in AI tools. Educational technology companies can achieve this by providing clear user interfaces, technical support, and community support systems. The importance of psychological factors in using AI educational tools has been validated58, suggesting that educational technology design should prioritize emotional design and user experience. In the future, the personalized adaptability and flexibility of AI tools will be crucial for development. AI tools should offer efficient teaching support and adapt to teachers’ needs. Companies should focus on personalizing and customizing AI systems, offering tailored teaching suggestions based on teachers’ models and students’ learning progress59. However, this study has some limitations. The sample mainly includes primary school English teachers. Future research could expand to include different subjects and education levels, combining interviews and classroom observations to further explore how teachers interact with AI tools, cope with technological challenges, and how these challenges impact their usage decisions and teaching outcomes. This study offers valuable theoretical and practical insights for the field of educational technology. Businesses and educators should address teachers’ psychological needs, innovate personalized teaching support, and reduce teacher anxiety to improve AI tool acceptance and effectiveness.