Since 1990, the United Nations (UN) has used the Human Development Index (HDI) to assess countries’ development using indicators of well-being and quality of life collected through census data. HDI scores are used by government agencies and nonprofit organizations to allocate resources. However, index rankings do not reflect local-level information, meaning, for example, people in developing regions of the top countries may be missing out on vital aid.
Now, a team of researchers including Hannah Druckenmiller from the California Institute of Technology, in collaboration with researchers from the United Nations, have developed a new model that combines satellite imagery and machine learning to zoom in and get more detailed data on a country’s population. In recent research, nature communicationsthe team estimated HDI scores for 61,530 municipalities around the world, covering approximately 7.58 billion people in 160 countries on all six populous continents.
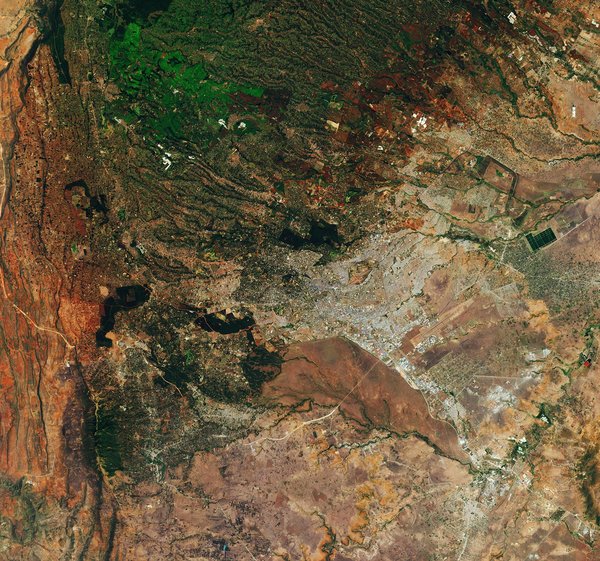
“Satellite imagery has historically been used to sense natural variables such as land cover and vegetation indices, but our study shows that satellite imagery can also be used to reveal socioeconomic variables such as wealth index, years of schooling, and life expectancy,” says Druckenmiller, assistant professor of economics at Caltech, William H. Hart Scholar, and co-author of the paper.
When assessing inequalities or developing poverty alleviation programs, researchers prefer to focus on areas of higher need rather than entire states or provinces. This is because, especially in developing countries, larger geographic areas are likely to consist of a mix of relatively wealthy urban areas and relatively poor rural areas. Administrative records at the local level can provide important data, but “about half of the world’s poorest countries have not had a census in the past 10 years,” Druckenmiller said. “So the question behind this project was, ‘Can we use Earth observation data to learn about inequalities within countries?’ It really responded to the needs of practitioners.”
The researchers used high-resolution satellite imagery from around the world to generate a series of image embeddings, or vectors. A number that summarizes the main visual characteristics of the image-Each administrative unit using the MOSAIKS (Multi-task Observation Using Satellite Imagery and Kitchen Sink) algorithm. We then trained a model to predict survey-based, state-level HDI measurements from image features. A key insight of the study is that MOSAIKS performs well with linear models, and this linear structure allows models trained on coarse-grained administrative data to be applied at finer geographic scales. The researchers therefore used state-level models to create municipal-level projections of the HDI and grid projections on a 0.1 degree scale (approximately 10 kilometers by 10 kilometers).
“We were really surprised at how well this method worked,” Druckenmiller said. “It’s an image, so you can see things related to different levels of wealth, such as infrastructure and land use, but you can’t see what’s happening in schools and hospitals or inside people’s homes. But when you look at the detailed data, you get a very different picture of global well-being than when you look at national aggregates.”
In fact, the researchers’ results revealed that more than half of the world’s population lives in municipalities whose happiness rankings differ from those assigned at the national level. After collecting predictions for all areas of interest, Druckenmiller and colleagues ran three exercises to test the model’s validity.
“One of the challenges was that we were trying to create a new data product at a higher resolution than the existing data product, so there was no way to directly validate the estimates,” she says.
The first test simply compared the model’s HDI predictions with data from different regions in Mexico, Brazil, and Indonesia where municipal-level records could be collected. The model performed well, with the best match for Indonesia, which had the most recent census data. In the second test, the researchers applied the exact same method used in the paper to a dataset that can be seen at very high spatial resolution and is known to be correlated with happiness.
“If you take a picture of the Earth at night, you’ll see that populated areas are brighter,” Druckenmiller said. “Previous research has shown that the presence of these night lights correlates well with income.” “Similar to what we did with the HDI, we trained a model to detect night lights at the state level and saw how well that model performed in recovering spatially granular measurements of night lights. This is not a direct validation of the HDI measurements, but a validation of the downscaling techniques we used to generate the HDI measurements.”
Finally, the researchers looked at data from the Demographic and Health Surveys (DHS) program, an organization that collects household-level data on asset ownership, using questions such as “Does your home have electricity?” “What kind of toilet does your household usually use?” “Do you have a bicycle?” These data are used to generate a composite index of wealth that is comparable across time and space. The researchers showed that they were able to recover similar village-level estimates for this wealth index using methods trained at the state level.
“This is kind of an interim test, because it’s a validation of the method, similar to the night-light test, but because wealth is also one of the three components of the HDI, it’s directly related to the measurements we were ultimately trying to predict,” Druckenmiller says.
She and her colleagues continue to study the performance of the MOSAIKS algorithm. A recent preprint by Druckenmiller et al. shares preliminary results from testing the algorithm on more than 100 ground conditions that are indicative of natural environments and human development. They found that their technology could accurately predict a wide range of variables, including house prices, literacy rates, and access to potable water, suggesting that the tool could be used to increase access to other types of data at relatively low cost. The researchers also made the HDI estimates, global image features, and MOSAIKS algorithm available to the public.
“The whole idea behind this algorithm is to democratize access to satellite imagery and machine learning by taking this very unwieldy image data and converting it into a format where researchers who have laptops and know how to run regressions can train powerful models,” Druckenmiller says. “My hope is that people will use our tools to open the box and gain a deeper understanding of human well-being in a way that can complement detailed household surveys, which are the gold standard of measurement, but are so expensive and time-consuming to implement that they are lacking in many parts of the world.”
Other authors of “Global High-Resolution Estimates of the United Nations Human Development Index Using Satellite Imagery and Machine Learning” are from Stanford University, the University of British Columbia in Vancouver, Canada, and members of the United Nations Development Programme. This research was supported by the United Nations Development Program’s Office of Human Development Reporting, the National Science Foundation Graduate Research Fellowship Program, the Harvard University Center for the Environment and the Harvard Data Science Initiative, the Sustainability Accelerator at the Stanford Doerr School of Sustainability, and AI for Earth with support from Microsoft and National Geographic.


