Identifying immune infiltration subtypes via consensus clustering
We calculated the enrichment scores of 28 immune cell types in the TCGA-BRCA cohort using ssGSEA. Subsequently, we performed unsupervised consensus clustering based on the area under the CDF curve and consensus heatmaps to determine the number of clusters. When k was set to 2, the heatmap clearly divided breast cancer patients into two clusters with distinct expression patterns (Fig. 1A, B). Additionally, the optimal number of clusters identified by PAC and Nbclust algorithms also supported this result (Supplementary Fig. 1 A, B). We defined the cluster results as Cluster 1 (C1) and Cluster 2 (C2), where C1 showed significantly higher levels of immune cell infiltration compared to C2 (Fig. 1C, D). Therefore, we defined C1 as an immunologically rich tumor and C2 as an immunologically poor tumor. Furthermore, to evaluate the stability and robustness of the clustering results, we used six algorithms to confirm the same findings: The TIMER, quanTIseq, MCP-counter, xCell, EPIC algorithm clustering showed that C1 had higher immune cell abundance than C2 (Supplementary Fig. 1 C). The ESTIMATE immune score of C1 was also higher than that of C2 (Fig. 1E).
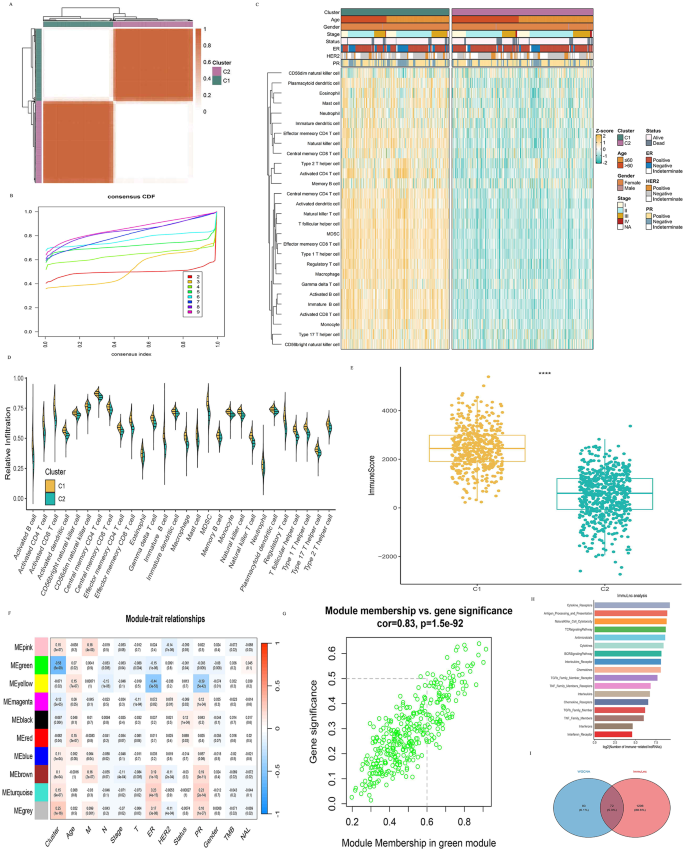
Identification of immune-related lncRNAs.A Consensus clustering scores (k = 2); B Optimal k-value selection; C-D Immune cell infiltration analysis between clusters (ssGSEA); E Differential ESTIMATE immune scores (TCGA-BRCA cohort, ****P < 0.0001); F Module-clinical trait correlation; G High-GS/MM lncRNAs in the green module; H ImmLnc-identified lncRNAs linked to immune pathways; I Overlapping lncRNAs from WGCNA and ImmLnc.
Construction of WGCNA and identification of immune-related lncRNA modules
To ensure the scale-free network of co-expression, we set the scale-free R2 to 0.55 and the soft threshold β to 5 (Supplementary Fig. 2D). Using the algorithm (combined dynamic tree cutting), we obtained topologically overlapping clusters, identifying 10 gene expression modules in different colors, and compared and analyzed the correlations between these modules (Supplementary Fig. 1E). We evaluated the expression of each module’s correlation with clinical characteristics such as immune clusters, age, TNM stage, Stage, ER, HER2, Status, PR, gender, tumor mutation burden(TMB), and neoantigen load(NAL) (Fig. 1F). The results showed that one module (Immune Cluster) exhibited the most significant correlation with clinical characteristics. In the green module, the correlation coefficient between GS and MM reached 0.96, indicating that the quality of lncRNA module construction is highly reliable (Fig. 1G). LncRNAs in the green module were selected for use in building models based on immune-related lncRNAs.
ImmuLncRNA algorithm screening for lncRNAs related to immunity
We used the ImmuLncRNA algorithm to derive lncRNA regulatory factors involved in immune regulation from lncRNA and gene expression data. From a functional regulation perspective, lncRNA that play a key role in immune regulation may have their target genes specifically enriched at the top or bottom of immune-related pathways. Based on the ImmuLncRNA function, we ultimately identified 1278 immune-related lncRNAs (Supplementary Table 1). We can see that most lncRNA are associated with “Cytokine_Receptors”,Antigen_Processing_and_Presentation “,” NaturalKiller_Cell_Cytotoxicity “,” TCRsignalingPathway “and” Antimicrobials“(Fig. 1H). Then, we took the intersection of the lncRNAs identified by the ImmuLncRNA algorithm and the hub lncRNAs identified by WGCNA. We obtained 72 immune-related lncRNAs(Fig. 1I).
Construction of a consensus immune-related lncRNA signature
We conducted a univariate Cox regression analysis on the 72 immune-related lncRNAs identified by the ImmuLncRNA algorithm and WGCNA algorithm, revealing that 15 lncRNAs were significant prognostic factors (Supplementary Fig. 1 F) for patients. We used a combination of 101 machine learning algorithms to construct a prognostic model (Supplementary Table 2) for these 15 lncRNAs. The results showed that the combination of Lasso regression and StepCox (backward) achieved an optimal average C-Index (Fig. 2A) of 0.71. Subsequently, we performed Lasso regression, using the minimum λ value from Lasso regression to build the prognostic model. We selected non-zero regression coefficient variables as feature screening results and then used StepCox (backward) to construct the model, ultimately identifying 9 lncRNAs significantly associated with prognosis (Fig. 2B-C).
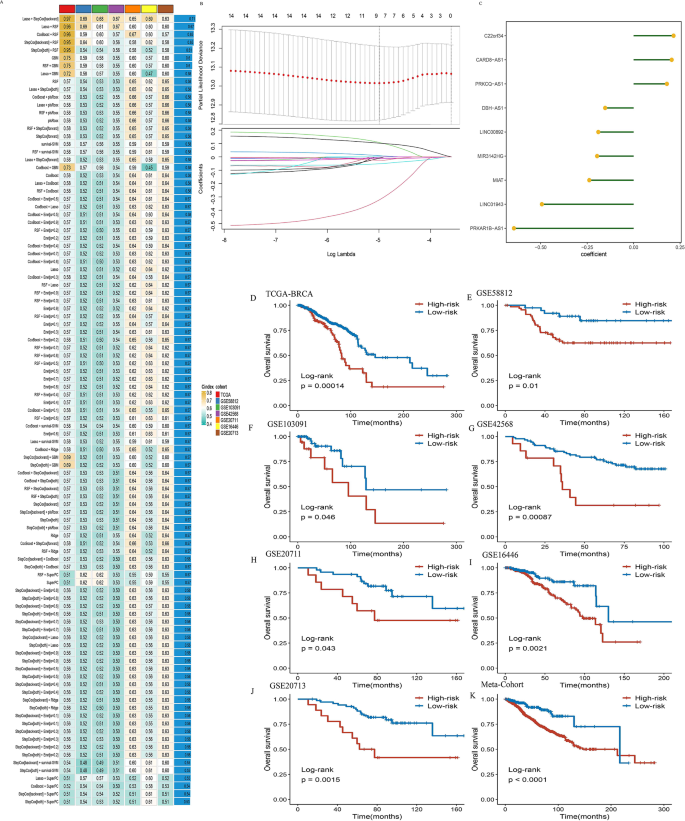
Integrative construction of a consensus signature. A Model construction via machine learning and cross-dataset validation using C-index. B Lasso regression identified critical prognostic genes in the TCGA-BRCA cohort. C Stepwise Cox regression revealed 9 lncRNAs as core prognostic biomarkers.D-K Significant OS differences between high/low IRLS groups were validated across multiple cohorts, with log-rank P < 0.05 in all analyses.
We developed a prognostic risk score model based on these 9 immunoregulatory IRLS, where each patient’s risk score is the sum of the product of the expression levels of these 9 immunoregulatory lncRNAs and their corresponding StepCox regression coefficients. The risk score was calculated as follows: IRLS risk score= (0.215*expression of C22orf34)+ (−0.153*expression of DBH-AS1)+ (−0.238*expression of MIAT)+(−0.190*expression of LINC00892)+ (−0.644*expression of PRKAR1B-AS1)+ (0.179*expression of PRKCQ-AS1)+ (−0.196*expression of MIR3142HG)+ (0.205*expression of CARD8-AS1)+ (−0.494*expression of LINC01943).Notably, PRKAR1B-AS1 exhibited the strongest association with the IRLS score. We determined the optimal cut-off values for high and low risk groups using the surv_cutpoint and surv_categorize algorithms. Subsequently, we performed survival analysis on the TCGA-BRCA dataset based on the optimal cut-off values for high and low risks. The results showed that patients in the high-risk group had significantly lower OS(P < 0.05),GSE58812, GSE103091, GSE42568, GSE20711, GSE16446, GSE20713, and Meta-Cohort data also demonstrated the same trend, with OS in the high-risk group being significantly lower than in the low-risk group (P < 0.05) (Fig. 2D-K). These findings confirm the robustness and reliability of our model. Subsequently, the optimal cutoff values for stratifying PRKAR1B-AS1 expression levels was determined using the surv_cutpoint and surv_categorize algorithms, categorizing patients into high- and low-expression groups. Patients with high PRKAR1B-AS1 expression consistently demonstrated significantly prolonged OS (P < 0.05) across all validation cohorts, including TCGA-BRCA, GSE58812, GSE103091, GSE42568, GSE20711, GSE16446, GSE20713, and the Meta-Cohort dataset (Supplementary Fig. 2). Additionally, to explore the impact of clinical characteristics, including IRLS, on patient OS, we conducted a multivariate Cox regression analysis on the aforementioned dataset, which revealed that IRLS is an independent prognostic factor for OS in breast cancer patients. These clinical characteristics include age, TNM stage, stage, ER, PR, HER2, TMB, NAL, gender, grade, and subtype(Supplementary Fig. 3). Subsequently, we further explored the predictive performance of IRLS on DFS in 11 ((TCGA-BRCA, GSE58812, GSE103091, GSE42568, GSE20711, GSE16446, GSE20713, GSE9195, GSE20685, GSE21653, GSE61304) datasets, which also showed that patients in the high-risk group had significantly worse DFS. Meta-Cohort also demonstrated the same result (P < 0.05). However, no significant difference in DFS was observed between high-risk and low-risk groups in the GSE9195 and GSE20685 datasets (Supplementary Fig. 4). This may be related to the deviations caused by the smaller sample sizes in these two datasets. In addition, we explored the effect of IRLS and clinical characteristics on DFS in 11 data sets. Multivariate Cox regression results showed that IRLS was an independent prognostic factor for DFS in TCGA-BRCA, GSE103091 and GSE20711 data sets, but IRLS was not observed to have a significant effect on DFS in other data sets (Supplementary Fig. 5).
Evaluation of the IRLS model
In order to verify the predictive performance of our IRLS model for breast cancer patient survival prognosis, we used a variety of algorithms to calculate different indicators of the model. We used the timeROC algorithm to calculate the AUC value of 1-, 3-, and 5-year OS in 8 data sets.
The AUC values for TCGA-BRCA at 1, 3, and 5 years were 0.782,0.776, and 0.744, respectively; 0.811,0.758, and 0.792 in GSE58812;0.832,0.778, and 0.692 in GSE103091; 0.793,0.796, and 0.776 in GSE42568;0.741,0.732, and 0.675 in GSE20711;0.753,0.721, and 0.653 in GSE16446;0.805,0.794, and 0.627 in GSE20713; and 0.775,0.754, and 0.649 in Meta-Cohort (Fig. 3A, Supplementary Table 3). The C-index values were 0.751,0.737,0.707,0.743,0.698,0.673,0.708, and 0.747, respectively (Fig. 3B, Supplementary Table 3). The IBS values were 0.109,0.112,0.153,0.116,0.107,0.111,0.127, and 0.115, and the iAUC values were 0.872,0.943,0.873,0.802,0.782,0.754,0.862, and 0. 756 (Supplementary Fig. 6, Supplementary Table 3). The values of these indicators show that our constructed IRLS Model has high reliability and distinctiveness in predicting OS for breast cancer patients. Subsequently, we evaluated the prognostic performance of PRKAR1B-AS1 expression in breast cancer patients. Using the timeROC algorithm, we calculated AUC values for 1-, 3-, and 5-year OS across eight datasets, while the survival algorithm was employed to compute C-index values. The results demonstrated robust predictive power of PRKAR1B-AS1 for patient outcomes (Supplementary Table 4), with high concordance between its predictive capacity and that of the IRLS model. Additionally, many studies have explored the predictive performance of clinical characteristics (such as age, TNM stage, Stage, ER, PR, HER2, TMB, NAL, gender, grade, and subtype) on OS, and our study also delved into this area. We compared the predictive performance of these indicators on survival outcomes with the IRLS model, and the results showed that our IRLS model had a higher C-index and was significantly different (P < 0.05) (Fig. 3C-I). AJCC stage plays a central role in the diagnosis and treatment of breast cancer patients, providing scientific evidence for clinical decision-making, prognosis assessment, and treatment optimization. To explore whether the combination of IRLS model and AJCC stage is superior to either IRLS or Stage alone, we used the combined IRLS model and AJCC stage as a benchmark, calculated the C-index values for different indicators, and found that the combined AJCC stage and IRLS indicators had the highest C-index at 0.792, with significant differences compared to the other two individual indicators (P < 0.05) (Fig. 3J).

IRLS model evaluation. A The AUC of 1-、3-、5-year OS prediction. B C-index of eight datasets. C-I Prognostic performance comparison with clinical variables. J Prognostic performance comparison of IRLS + Stage vs. IRLS and AJCC stage alone in TCGA-BRCA (n = 1108). *P < 0.05; **P < 0.01; ***P < 0.001; ****P < 0.0001.
Assessment of gene expression-derived predictive models for breast cancer
To verify the predictive performance of our constructed IRLS model compared to other models that have been published, we retrieved and collected 95 gene expression prediction models (Supplementary Table 5). These gene expression markers are involved in various biological processes. The results of univariate Cox regression suggest that among all models, only IRLS showed significant differences in predicting OS for breast cancer patients across eight datasets, with lower IRLS scores associated with longer OS (Fig. 4A). Subsequently, we evaluated the C-index of all models across the eight datasets and compared it with the C-index of IRLS. We found that IRLS had the highest C-index in the TCGA-BRCA, GSE42568, GSE58812, GSE103091 and Meta-cohort datasets, showing significant differences from most other models (P < 0.05). In the GSE20711, GSE20713 and GSE16446 datasets, IRLS also demonstrated excellent predictive performance, showing significant differences compared to other models (P < 0.05) (Fig. 4B). It can be observed that other models exhibit poorer stability compared to the IRLS model, performing well only on their own training sets or a few other datasets, while performing poorly on other validation datasets. This may be related to our use of multiple machine learning algorithms to build the models.
Predictive value of IRLS score for different treatment regimens

Prognostic model evaluation in breast cancer cohorts.A Univariate Cox analysis of IRLS and 95 published models in TCGA-BRCA(n = 1108), GSE42568(n = 88), GSE58812(107), GSE103091(238), GSE20711(n = 88), GSE20713(n = 104), GSE16446(n = 102) and Meta-cohort(1835).B C-index comparison of IRLS and 95 published models in TCGA-BRCA, GSE42568, GSE58812, GSE103091, GSE20711, GSE20713, GSE16446 and Meta-cohort. *P < 0.05; **P < 0.01;***P < 0.001; ****P < 0.0001.
Previous studies have suggested that lncRNA may be associated with the resistance to chemotherapy and targeted therapy in breast cancer patients. To explore this, we investigated the predictive value of IRLS scores for different treatment outcomes in breast cancer patients. Six datasets based on Paclitaxel treatment were included. A total of 112 eligible patients were enrolled, with 61 responding to Paclitaxel and 51 not responding. The results showed that the IRLS score for patients who responded to Paclitaxel was significantly higher than those who did not (P < 0.05) (Fig. 5A-F). To further evaluate the predictive power of our model, we conducted ROC analysis, which revealed area under the curve values of 0.814,0.850,0.763,0.817,0.760, and 0.819 for the GSE50948, GSE16179, GSE22513, GSE28844, GSE66305 and GSE33568 datasets (Fig. 5G-L). This indicates that IRLS has high discriminative value in predicting the response to Paclitaxel treatment in patients. In addition, we explored the differences in IRLS scores between responders and non-responders in the anastrozole-fulvestrant-gefitinib (AFG) combination therapy in the GSE33568 and GSE50948 datasets. The results showed that the IRLS score for responders to AFG was significantly lower than that of non-responders (P < 0.05) (Fig. 5M-N). The area under the curve for the GSE33568 and GSE50948 datasets was 0.812 and 0.792, respectively, which also indicates that the IRLS score has high predictive value in predicting AFG regimen responsiveness (Fig. 5O-P).

Predictive value of IRLS for Paclitaxel and AFG response.A-F IRLS score distribution between responders and nonresponders of Paclitaxel in sixt datasets. G-L ROC curves of IRLS to predict the benefits of Paclitaxel in sixt datasets.M-N IRLS score distribution between responders and nonresponders of anastrozole-fulvestrant-gefitinib (AFG) in two datasets. O-P ROC curves of IRLS to predict the benefits of AFG in two datasets.*P < 0.05; **P < 0.01;***P < 0.001; ****P < 0.0001.
Impact of IRLS on ICI therapy
We applied the ssGSEA algorithm to quantify immune scores in patients from the TCGA-BRCA and Meta-GEO cohorts. The results revealed that low-risk group patients exhibited significantly higher immune cell infiltration (Fig. 6A, Supplementary Fig. 7 A), while a negative correlation was observed between IRLS scores and immune cell infiltration levels (Fig. 6B). In the TCGA-BRCA dataset, we found that as the IRLS score increased, the expression levels of CD8A and PD-L1 decreased(Fig. 6C, D, Supplementary Fig. 7B, C). A similar trend was observed in the GSE20711 dataset (P < 0.05) (Fig. 6E, F). We found that the expression levels of CD8A and PD-L1 were higher in the low-risk group compared to the high-risk group (Fig. 6G-J). Additionally, we discovered that IRLS can predict molecular expression in breast cancer patients, with lower IRLS scores in TNBC patients (Supplementary Fig. 7D, E) (P < 0.05). Subsequently, we evaluated the predictive power of IRLS for molecular expression in breast cancer patients using ROC curves, which showed an AUC value of 0.677 in TCGA-BRCA and 0.751 in GSE20711 (Fig. 6K, L). We used the TCGA-BRCA dataset to evaluate the relationship between IRLS and TMB or NAL. The results showed that there was a significant negative correlation between IRLS scores and TMB or NAL (P < 0.05) (Fig. 6M, Supplementary Fig. 7 F). Patients with lower IRLS scores may have higher genetic instability. Additionally, we assessed the predictive performance of IRLS scores on atezolizumab treatment response using the GSE157284 dataset. The results indicated that compared to CD8A and PD-L1, IRLS scores achieved the highest AUC value of 0.625, suggesting that IRLS has some predictive value for the efficacy of atezolizumab therapy (Fig. 6N).

Validation of IRLS-ICI associations. A The relationship between IRLS and immune infiltration in TCGA-BRCA. B Correlation heatmap of Pearson’s correlations (IRLS and immune infiltration) in TCGA-BRCA and Meta-GEO. C-D IRLS-CD8A correlations in TCGA-BRCA.E-F IRLS-PD-L1 correlations in GSE20711.G-H Intergroup CD8A and PD-L1 differences in TCGA-BRCA. I-J Intergroup CD8A and PD-L1 differences in GSE20711. K-L ROC curves of IRLS for molecular expression prediction in TCGA-BRCA and GSE20711. M Correlation between IRLS and TMB. N ROC analysis (IRLS/CD8A/PD-L1) for atezolizumab response prediction. *P < 0.05; **P < 0.01;***P < 0.001; ****P < 0.0001.