ANN modeling
The number of nodes and the configuration of hidden layers directly influence the learning capacity, performance and computational efficiency of ANNs. In particular, increasing the number of nodes and hidden layers enhances an ANN’s ability to learn complex data, but this increase may lead to overfitting, thereby reducing the model’s performance when processing new data. Hence, determining an appropriate number of nodes and designing hidden layers are critical factors in optimizing ANN performance. In general, simple functions with output values that increase or decrease linearly based on input values can be adequately learned using only one hidden layer. However, electropolishing exhibits a complex pattern wherein surface roughness repeatedly increases due to surface damage under certain conditions. Thus, we determined that at least two hidden layers would be required in this investigation. To decide on the number of nodes in a hidden layer, we referred to the methodology based on Lachtermacher and Fuller’s empirical law, expressed in Eq. (3)47:
$${\text{0}}{\text{.11P = XHN (I + 1) = 0}}{\text{.3P}}$$
(6)
where P represents the size of the learning data, and I denotes the number of input variables.
The dataset size was increased using data augmentation technology48. The existing dataset was replicated 20 times, and random noise with a mean of 0 and a standard deviation of 0.05 was incorporated to create new data. This approach resolved the data scarcity issue and improved the model’s generalization performance without altering surface roughness. Consequently, 1,620 data points were secured (= 81 electropolishing conditions × 20 instances of data augmentation). The number of nodes calculated using Eq. (3) ranged from 29 to 81, on whose basis the node count was expanded from 10 to 100 to evaluate ANN performance across various configurations.
Table 3 compares model performance (fitness) under different numbers of nodes in the hidden layers. Performance was evaluated using the MSE and the coefficient of determination (R2). The closer the MSE and R2 were to 0 and 1, respectively, the better the performance of the ANN model. As evident from Table 3, increasing the number of nodes in the hidden layers improved the MSE and R2 values. In particular, under 70 nodes, the MSE decreased to 0.032070, and the R2 improved to 0.984776. With node count exceeding 70, however, performance improvements became negligible, and computation time increased. These effects elevated the risk of overfitting, potentially degrading prediction performance. Thus, the optimal model configurations determined in this examination were 5, 70 and 1 node in the input layer, two hidden layers and output layer, respectively.
ANN model validation
The ANN deep learning model for electropolishing was trained using a dataset of 1,620 data points, of which 1,296 (80%) were randomly selected for training, while 324 (20%) were used for validation49. The ANN was trained over 10,000 epochs50.
Figure 3 illustrates the variations in the loss function during the training process. Training loss represents the error between the actual value and the output value calculated using the model for the training data. The validation loss represents the error between the actual value and the output value calculated using the validation data, independent of the training data. Both the training and validation losses decreased significantly during the first 110 epochs before stabilizing at nearly constant values. The final training loss was 4.53 × 10⁻², and the validation loss was 3.74 × 10⁻². To mitigate overfitting concerns during training, early stopping and callback functions were implemented in this work51. Training was terminated early at approximately 800 epochs.

Loss functions for the training and validation for deep learning.
Figure 4 compares the surface roughness predicted using the ANN with the actual experimental results. In ideal conditions, when the predicted and actual values match perfectly, the slope of a regression line is 1, and the y-intercept is 0. In this investigation, the slope of the training data exceeded 0.94, with a y-intercept of 0.05246 and an R2 of 0.99168. The slope of the validation data exceeded 0.95, with a y-intercept of 0.0764 and an R2 of 0.99198. Jalal et al. used artificial intelligence to model the expansion strength of soil52. Among various prediction models, gene expression programming yielded R2 values of 0.91 and 0.95 for training and validation data, respectively, which were reported as indicators of high predictive performance52. Similarly, the ANN model developed in the present exploration was regarded as a reliable predictive tool for evaluating surface roughness during electropolishing given that the R2 values of both the training and validation data exceeded 0.94.

Comparison between the experimental and predicted roughness for (a) 1296 training data and (b) 324 validation data. Linearity is sufficiently high to regard the ANN model as accurate.
Optimization of the electropolishing process
As with the use of analytical tools in Taguchi robust design, this inquiry involved adopting an ANN to derive statistical results for estimating the main effects of each factor that influenced surface flatness. A dataset of 1,000 randomly generated electropolishing conditions was used, and surface roughness values were predicted using the ANN. The main effects of the factors were ascertained via local averaging (Fig. 5).
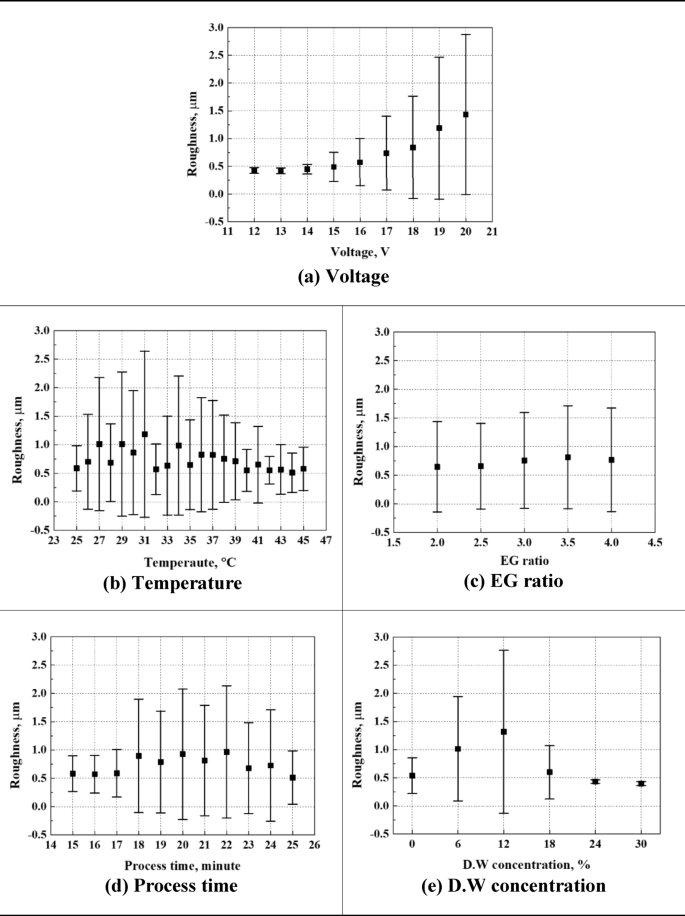
Main effects of the parameters on the roughness. The roughness were predicted using the ANN from 1000 random combinations of parameters and locally averaged for plotting.
Surface roughness increased with rising voltage (Fig. 5). In particular, in the initial voltage range of 12 to 14 V, surface roughness exhibited a small standard deviation (0.05–0.09), pointing to stable electropolishing conditions. Beyond 15 V, however, the standard deviation increased, reflecting diminished processing stability. This linear variation in surface roughness suggests that voltage is the most significant determinant of surface roughness.
In general, increasing temperature is expected to enhance ionization reactions and reduce surface roughness during electropolishing. However, the main effect analysis using the ANN model in this investigation revealed that temperature did not significantly affect surface roughness. This can be interpreted as the temperature range of 25–45 °C set in this investigation being appropriate for electropolishing, and the contribution of temperature being relatively limited from a data-driven perspective.
The ethylene glycol (EG) ratio directly influences the viscosity of the electrolyte due to hydrogen bonding between hydroxyl groups (-OH) in EG. When the EG ratio is low, the reduced viscosity enhances ion mobility and reaction activity, but may cause localized current concentration, leading to uneven surfaces. At higher EG ratios, mass transfer becomes more stabilized, enabling more uniform current distribution. However, excessive viscosity can cause uneven current density and localized damage such as pitting. In fact, in this investigation, increasing the EG ratio from 2.5 to 3.0 led to a slight increase in surface roughness from 0.65 μm to 0.75 μm, though not statistically significant. In addition, even at an EG ratio of 4.0, no severe effects were observed, suggesting that the process was relatively stable within the tested range.
Regarding processing time, surface roughness tended to stabilize beyond a certain threshold. Between 18 and 24 min, surface roughness presented consistent mean values and standard deviations, indicating that this range is suitable for stable processing. However, in ANN analysis, processing time was not learned as a dominant influencing variable, which is interpreted as a result of the safe time range used in the experiments that did not trigger excessive reactions.
When distilled water was added in the 6–12% range, it enhanced ion diffusivity in the electrolyte, promoting the electropolishing reaction. However, this also led to decreased uniformity of surface dissolution, increasing surface roughness variation. In particular, the lowest surface roughness was observed at the 12% concentration condition, which is considered to represent the optimal composition where the fluidity of the electrolyte and ion mobility are well balanced. In contrast, when the distilled water concentration increased to 18% or higher, the electrolyte became excessively diluted, leading to reduced electropolishing efficiency, and consequently, a deterioration in surface quality. This trend was also reflected in the ANN main effect analysis, where the influence of distilled water was significant up to 12%, but diminished rapidly beyond that point and was no longer considered a key factor.
The analysis conducted using Taguchi robust design reflected that only voltage significantly affected surface roughness and that all the other factors had little effect. However, the added distilled water had the highest effect next to voltage. These results demonstrate that the prediction results derived via Taguchi robust design and ANN modeling exhibited similar trends overall.
Figure 6 visualizes the interaction effects of the factors on two electropolishing processes. This image is similar to Fig. 5, which displays averaged results by region as a contour plot. Graphing was implemented using development software (Visual Studio) and Python. Graph generation with code execution was performed independently by creating a virtual environment in Anaconda software.

Interaction effects of binary electropolishing condition on the roughness. The roughness were predicted using the ANN from 1000 combinations of random electropolishing condition and locally averaged for plotting.
In the contour plot in Fig. 6, the x-axis and y-axis represent the factors affecting electropolishing. The surface roughness produced by the interaction of two factors is expressed in a color (red–blue) range, with the area marked in dark blue illustrating low surface roughness. In general, when contour lines are perpendicular or horizontal to each other, then two given factors have no interaction effect. In Fig. 6, the graphs corresponding to two given factors are labeled 1 to 10 to improve readability. The main results are as follows.:
First, the interaction between voltage and processing time (Fig. 6-(1)) revealed that short durations at high voltage (18–20 V) resulted in increased surface roughness due to rapid reactions driven by high current density. Even under long durations, excessive current led to surface damage.
The interaction between voltage and temperature (Fig. 6-(2)) indicated a synergistic effect, where increased values of both parameters accelerated reactions, and may cause localized damage such as pitting under aggressive conditions. In the voltage and EG ratio interaction (Fig. 6-(3)), higher voltage with increased EG ratio raised electrolyte viscosity, leading to localized overcurrent, and increased surface roughness.
However, the mostly vertical contour lines in Fig. 6(1)–(3) suggest that voltage had a more dominant individual effect than a strong interaction between parameters.
In the case of the interaction between voltage and distilled water concentration (Fig. 6-(4)), a significant increase in surface roughness was observed with increasing voltage when the distilled water concentration was 16% or below. This was likely due to enhanced ion diffusion triggering excessive reactions. In contrast, when the distilled water concentration was 16% or higher, the dilution effect of the electrolyte reduced the sensitivity to voltage changes, resulting in a weakened interaction.
In the interaction between temperature and processing time (Fig. 6-(5)), it is generally expected that higher temperatures enhance ion mobility, while prolonged processing times can lead to surface damage due to extended reaction duration. However, in this investigation, under processing times exceeding 25 min, the formation of a passivation layer between the electrolyte and the titanium surface appeared to stabilize surface reactions, resulting in uniformly low surface roughness overall. However, the irregular contour patterns in the ANN analysis suggest the absence of a clear interaction.
The interaction between processing time and EG ratio (Fig. 6-(6)) revealed that the lowest surface roughness occurred at 25 min and EG ratio 3.0, likely due to appropriate viscosity and flow conditions. However, contour lines were irregular when EG ratio was too low or high, indicating no distinct interaction pattern.
In the interaction between processing time and distilled water concentration (Fig. 6-(7)), when the distilled water concentration was 14% or below, surface roughness tended to increase as the processing time increased, due to the excessive progression of the reaction. In contrast, at concentrations of 14% or higher, the effect of processing time was diminished due to electrolyte dilution, resulting in relatively flat contour patterns.
The interaction of temperature and EG ratio (Fig. 6-(8)) presented that at high temperatures (35–45 ℃), elevated EG ratio reduced viscosity and enhanced ion mobility, causing excessive reactions and increased roughness. The combination of 25–35 ℃ and EG 2.5 offered balanced viscosity and mobility, resulting in the lowest surface roughness.
In the interaction of temperature and distilled water (Fig. 6-(9)), high water concentrations (20–30%) diluted the electrolyte, stabilizing surface roughness. However, in the region indicated by the blue arrows, a linear decrease in surface roughness was observed as the temperature increased from 35 to 45 °C and the distilled water concentration decreased to 10% or below.
In the EG ratio and distilled water interaction (Fig. 6-(10)), when both were high, dilution offset their effects, limiting surface roughness change. But, when the distilled water concentration was maintained at 15% or below, the increased ion diffusivity led to a higher reaction rate, which in turn resulted in a tendency for surface roughness to increase. Specifically, as indicated by the red arrow, when the EG ratio increased from 2.0 to 3.0 and the distilled water concentration increased from 0 to 10%, the surface roughness increased. In contrast, as shown by the blue arrow, when the EG ratio increased from 3.0 to 4.0 and the distilled water concentration decreased from 10 to 0%, the surface roughness decreased. Therefore, it can be confirmed that the distilled water concentration of 10% or below has a significant effect on surface roughness.
In reducing surface roughness, advantageous strategies are to lower voltage (graphs 1–4) and pair a high voltage with a distilled water concentration of 0%. Correspondingly, the interaction analysis performed via the ANN revealed that the red dotted lines in graphs 4, 9 and 10 reflect interaction between these two factors. In particular, graph 4 presents a strong interaction based on the linear increase in surface roughness with rising concentration of added distilled water over the entire voltage range.
The results of Taguchi-based interaction analysis conducted by other researchers mostly reflect trends similar to those uncovered via the ANN modeling in the current work16. In particular, both analyses uncovered interactions between voltage and added distilled water. However, the Taguchi robust design generated ambiguous interactions between temperature and distilled water concentration as well as that between the choline chloride-to-ethylene glycol ratio and distilled water concentration within the detailed range. These differences are attributed to the dissimilarities in design and process between the two technologies. In the case of Taguchi robust design, only two to three levels of interaction are considered based on experiments involving orthogonal arrays. However, ANNs can be used to analyze interactions among multiple variables by modeling the complex nonlinear relationships between them. Accordingly, the contour plots generated from the ANN model—visualizing the interactions among voltage, ethylene glycol ratio, processing time, distilled water concentration and temperature—clearly reveal nonlinear interdependencies between variables that were difficult to capture using the conventional Taguchi method, thereby enabling deeper process interpretation and insight.
Table 4 presents the results of ANN predictions regarding the five smallest conditions that resulted in surface roughness exceeding 10 nm. It is practically impossible to achieve a surface roughness of 0 nm in various material processing methods, such as electropolishing. It is especially difficult to precisely control all factor conditions during electropolishing, wherein even small fluctuations can generate differences in surface roughness of tens of nanometers or more. Accordingly, we set the lower limit for surface roughness to 10 nm in this investigation. The first ANN-derived conditions in Table 4 are the optimized conditions for electropolishing, resulting in the smallest surface roughness. These conditions were a voltage of 20 V, a processing time of 21 min, a temperature of 42 °C, an electrolyte with a choline chloride-to-ethylene glycol ratio of 1:4 and a distilled water concentration of 0%. Under these conditions, the voltage and choline chloride-to-ethylene glycol ratio were the highest, and the concentration of added distilled water was the lowest. In conditions 2 to 5, voltage, processing time and temperature were relatively high, while the concentration of added distilled water remained consistently low. In summary, reducing surface roughness necessitates high voltage, processing time and temperature, along with a low concentration of added distilled water.
Comparison of Taguchi robust design and ANN after electropolishing
Figure 7 presents the results of the 3D image and 2D profile analyses of the surfaces of the specimens after electropolishing. These analyses were carried out via atomic force microscopy under the five optimal conditions (Table 4) derived through ANN modeling. Height was calculated as the difference between the highest peak and the lowest valley in the 2D profile. Small values of surface roughness and height indicate a smooth surface. Micallef et al. reported that when surface roughness is less than 50 nm after electropolishing, the microcrystal grain orientation on the surface of a material is uniform, resulting in a mirror-like specular reflection shape53. In the present examination, post-electropolishing surface roughness under conditions 1 to 5 was at the nanoscale, with all values below 20 nm. As a result, optical microscopic observations revealed that all the specimens had a mirror-like shape (Fig. 8). A mirror-like surface appears to regularly reflect and minimally scatter light. Accordingly, for cases 1 to 3 in Fig. 8, the dark tones in the images are ascribed to the uniform reflections caused by the very smooth and flat surfaces of the specimens.

Results of 3D images and 2D profiles after electropolishing for the five optimal conditions derived from ANN.

Surface appearance after electropolishing for the five optimal conditions derived from ANN.
As illustrated in Fig. 7, both surface roughness and height values increased from cases 1 to 5. In particular, cases 1 and 2 are relatively more uniform than cases 4 and 5 in the 2D profile. The surface roughness and height values of specimen 1 were the smallest at 4.162 and 22.596 nm, respectively, indicating that these are optimal electropolishing conditions. Voltage extensively influences surface roughness. Accordingly, large voltage fluctuations are thought to cause greater variations in surface roughness. In consideration of this issue, we deployed an ANN model, whose results led us to conclude that it is important to minimize voltage variability in keeping surface roughness at the nanoscale. On this basis, the ANN model was regarded as having calculated the voltage to be 20 V in all electropolishing conditions. This prompted the conclusion that the ANN optimized surface roughness by changing the remaining conditions.
Figure 9 compares the surface roughness predicted by the ANN and Taguchi analyses with the experimentally measured values obtained through electropolishing. When the ANN model was trained, these experimental data were excluded from the training or validation data. The ANN predictions somewhat differed from the experimental data, but this discrepancy was negligible, falling within the range of 12 to 59 nm. In addition, the overall trend of increasing surface roughness from conditions 1 to 5 was consistent with both the predicted and experimental results. These outcomes demonstrate that ANN modeling can effectively predict surface roughness and the trends characterizing its changes. Conversely, the results predicted by Taguchi robust design differed from the actual measurements by 142 to 172 nm, confirming that its prediction performance was inferior to that of the ANN model16. In particular, the trend of surface roughness changes in conditions 2 and 4 was inconsistent with the experimental data. Therefore, an ANN model can predict surface roughness with higher accuracy than Taguchi robust design.

Comparison of actual electropolishing roughness with predicted data using Taguchi and ANN. (Experimental data were not included in the training and verification data for ANN).
The scientific contribution of this investigation lies in the application of an artificial neural network (ANN)-based predictive model to the eco-friendly electropolishing process of titanium, thereby overcoming the limitations of conventional statistical methods. In particular, the ANN model effectively learns the nonlinear and multivariate interactions among process parameters, demonstrating its potential as a data-driven optimization tool that cannot be realized through the conventional Taguchi robust design.
The Taguchi method, while advantageous for analysis within a fixed experimental design, has limitations in predictive capabilities for unexplored regions outside the design space. By contrast, the ANN model can capture complex nonlinear relationships from the training data and maintain high predictive performance for new, untested process conditions.
In fact, the ANN model developed in this investigation achieved a high coefficient of determination (R² > 0.98), and reduced the root mean square error (RMSE) by over 80% compared to conventional Taguchi analysis. Moreover, the optimal process conditions predicted by the ANN model were experimentally validated, successfully achieving a nanoscale surface roughness (Ra < 20 nm), thus verifying the model’s effectiveness.
Furthermore, the ANN-based data-driven framework proposed in this investigation is not limited to electropolishing; it can be extended to other surface treatment processes such as anodizing and additive manufacturing, where nonlinear interactions among variables are also critical.