ML-driven workflow
To construct the ML model, we first compiled a database from 55 manually screened research papers, including COF descriptors and their corresponding photocatalytic yields (μmol h−1 g−1) (Fig. 2a). Due to the skewed distribution of photocatalytic yields, normalization was used before data training (Supplementary Fig. 1). The descriptor framework integrates three core components: structural information, reaction conditions and physics-informed descriptors. As for structural information, the structures of COFs were transformed into small molecular structures composed of their repeat units. These molecular structures were encoded using the Simplified Molecular Input Line Entry System (SMILES)42 and further converted into count Morgan fingerprinting43, implemented in RDKit44 (Supplementary Fig. 2). For reaction conditions, three key parameters were considered: types of sacrificial agent (one-hot encoding), sacrificial agent ratio and oxygen gas ratio. Similarly, for physics-informed descriptors, three physicochemical properties, band structures (quantified by bandgap), charge separation (quantified by charge disparity) and hydrophilicity (quantified by MolLogP), were carefully selected.

a, Database construction: structural and physics-informed descriptors of 165 COFs, along with their corresponding photocatalytic H2O2 yields under various reaction conditions. BA, benzyl alcohol; EA, ethanol; NHE, normal hydrogen electrode. b, The prediction model integrates structural information, reaction conditions and physics-informed properties as inputs to predict H2O2 yield. c, Bandgap information generation model based on COF structures. d, The combined model is used to predict the constructed database and synthesize the predicted COF with optimal structure, followed by experimental evaluation.
Based on this dataset, we conducted a systematic quantitative benchmark comparison with several advanced architectures, including a standard deep neural network (DNN), a graph neural network, a Transformer-based model and a self-supervised pretraining framework (ChemBERTa)45. The results indicate that the baseline DNN (model 1, test root mean square error (RMSE) 3.99) achieved the best initial performance on this small-sample COF dataset, substantially outperforming the graph neural network (test RMSE 4.32), Transformer (test RMSE 4.21) and ChemBERTa framework (test RMSE 5.61) (Supplementary Fig. 3 and Supplementary Tables 2–5). Building upon the DNN, we further developed a unified computational framework (Fig. 2b) that integrates structural information, reaction conditions and physicochemical descriptors as input features for predicting H2O2 yield, achieving an RMSE of 3.52 on the test set (model 3; Supplementary Fig. 4). However, the model’s applicability can be constrained by the lack of direct bandgap information for new input structures, as experimental acquisition requires material synthesis, which is impractical for large-scale screening.
To address this limitation, we further trained a surrogate random forest (RF) model using the existing dataset (Fig. 2c). This model predicts the conduction band (CB) and valence band (VB) positions based on COF structures and subsequently calculates the corresponding bandgap values. The bandgap predictions demonstrate strong agreement with experimental measurements, with the CB model achieving an RMSE of 0.29 and the VB model an RMSE of 0.36 on the test set (Supplementary Fig. 5). By integrating the performance prediction model (Fig. 2b) with the bandgap generation model (Fig. 2c), we established a unified framework (Fig. 2d) capable of predicting H2O2 yield for any newly screened COF structures. To enhance the model’s robustness, an ensemble approach was adopted by integrating ten independently trained models. The training process is described in detail in the Methods. Finally, the top-ranked COF structures, selected on the basis of predefined screening criteria, were experimentally validated to assess their actual H2O2 production performance.
Model optimization for model improvement
To address challenges in ML model development and enhance prediction accuracy, we implemented an optimization framework composed of complementary data-level and feature-level enhancement strategies (Fig. 3). In the data-level pathway, given the limited availability of COF structures in reported studies, structural augmentation was used to expand the dataset. Specifically, we generated multiple chemically equivalent structures with varied representations. Feature vectors were constructed for several equivalent structures, increasing the original molecular samples to around 1,000 (Fig. 3a and Supplementary Figs. 6 and 7). This strategy enhanced the diversity of the training set, enabling the model to better capture underlying molecular patterns and features, even with a limited dataset (Supplementary Fig. 8).

a, Schematic diagram of data augmentation via chemically equivalent structures. b–d, Schematic illustrations of the physical meanings of the bandgap (b), charge separation descriptor (c) and hydrophilicity descriptor (d). Eg, band gap energy; Ehv, photon energy of incident light; ORR, oxygen reduction reaction; WOR. water oxidation reaction. e, Distribution of COF CB and VB positions. f,g, Correlation between charge disparity, MolLogP and experimental H2O2 yield. The centre line indicates the mean; box limits denote the upper (Q3) and lower (Q1) quartiles; whiskers extend to 1.5× the interquartile range (IQR); and all data points are shown (n numbers from left to right for f: 161, 31, 73 and 34; for g: 125, 159, 11 and 4). h, Comparison of learning curves for different models. i, RMSE loss for models trained with different processing methods.
Source data
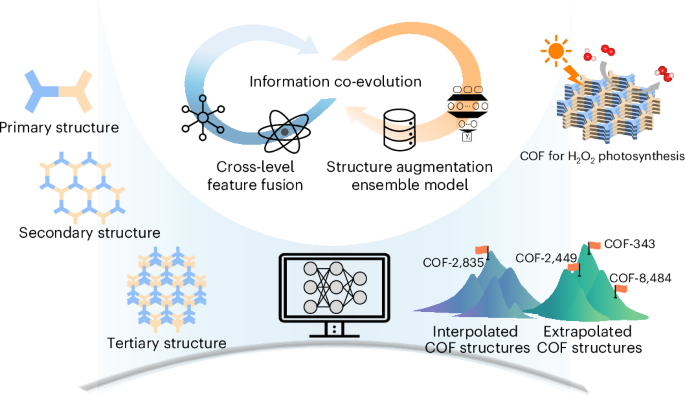
However, model feedback showed that, although this data-level optimization (data augmentation and ensemble methods) improved accuracy and robustness, it provided limited gains in mechanistic interpretability. To address this, we introduced a feature-level optimization via a cross-level feature fusion strategy. Current COF descriptors depend on primary molecular fragment information, lacking accurate modelling of tertiary structure, which limits their applicability in predicting photocatalytic performance. To compensate for the absence of explicit tertiary-structure representation without resorting to computationally expensive 3D modelling, we selectively integrated representative molecular-fragment features with photocatalysis-relevant physics-informed descriptors, such as bandgap, band positions, charge disparity and MolLogP (Supplementary Fig. 9). These descriptors partially capture properties associated with the tertiary structures of COFs. All these physicochemically meaningful descriptors are intrinsically linked to the key photocatalytic processes, including light absorption, charge separation and surface reactions. This targeted fragment–descriptor fusion constitutes the feature-level optimization in our framework and underpins the proposed ‘information co-evolution’ mechanism, resulting in concurrent improvements in predictive accuracy and mechanistic interpretability.
The bandgap (Fig. 3b) represents the energy difference between the CB and the VB of a COF photocatalyst, determining the range of the light spectrum the photocatalyst can absorb, and plays a crucial role in determining the performance of photocatalysts46,47,48. The collected bandgap data (Fig. 3e) indicate that the CB positions of all structures are above 0.68 eV, suggesting that H2O2 photosynthesis is kinetically feasible. In addition, most CB positions are above −0.33 eV, indicating the potential for a two-step oxygen reduction reaction pathway: photoexcited electrons initially reduce oxygen to superoxide (\({{\rm{O}}}_{2}{\cdot }^{-}\)), which subsequently reacts further to form H2O2. Moreover, the intramolecular polarity of COFs, which facilitates free charge separation, is strongly associated with the presence of D–A structures. These structures play a crucial role in influencing H2O2 photosynthesis49. Inspired by this, we define charge disparity as the difference between the maximum partial charge (MaxPartialCharge) and the minimum partial charge (MinPartialCharge), as computed using RDKit (Fig. 3c). The photocatalytic performance versus charge disparity fitting curve reveals a positive correlation between the H2O2 generation rate and charge disparity (Fig. 3f). In addition, the MolLogP value, computed via RDKit, provides molecular-level hydrophobicity information. A lower MolLogP value suggests a reduced hydrophobicity, which may contribute to improved dispersion of the COF in aqueous media50, thereby enhancing H2O2 photosynthesis (Fig. 3d). The fitting data show a negative correlation between photocatalytic performance and MolLogP (Fig. 3g), consistent with our previous analysis.
Comparison of learning curves before and after these enhancements shows a progressive optimization of model performance as information co-evolved across data-level (data augmentation and ensemble optimization) and feature-level (descriptor–fragment fusion) pathways (Fig. 3h and Supplementary Fig. 10). Following this co-evolution process, the final validation error decreased from 4.70 to 3.85, and further to 3.31 (Fig. 3i). These results confirm that integrating data-level and feature-level enhancements outperforms models relying solely on primary structural information, quantitatively validating the effectiveness of the underlying information co-evolution mechanism.
Understanding the key factors for photocatalysis
Identifying the critical factors governing photocatalysis is fundamental for developing high-performance COF photocatalysts. By combining multiscale model interpretation (spanning monomer-level structures to physics-informed descriptors), we demonstrate how specific molecular features and key descriptors collectively enhance photocatalytic activity, establishing design principles for targeted COF synthesis. To elucidate the underlying ML models targeted for these materials, we performed a model explanation at both the monomer and descriptor scales (Fig. 4). On the monomer scale, due to the abundant dataset, our primary focus was on imine-linked COFs51 (Supplementary Figs. 11 and 12). By combining amine and aldehyde monomers sourced from literature and the CoRE COF database52, we constructed a prediction database containing 10,881 potential COF structures (Fig. 4a). The monomers used in the dataset are illustrated in Supplementary Figs. 13 and 14.

a, Construction of the prediction database through a free combination of amine and aldehyde monomers. b,c, Heatmaps of predicted performance for the entire database (b) and top ten monomers (c). Each cell represents the average performance of ten models; rows and columns are ranked by the overall average performance of each monomer across all combinations. d,e, Structures of the top ten amine (d) and aldehyde (e) monomers. f, SHAP summary plot showing descriptor importance ranking (vertical axis) versus impact magnitude (horizontal axis), with point colours representing feature values. g, Corresponding SHAP bar plot quantifying mean absolute contributions, with top-ranking molecular fragment structures annotated.
Source data
We then applied the previously trained model to predict the photocatalytic performance of these structures. As shown in Fig. 4b, each pixel represents a unique COF structure formed by a specific combination of amine and aldehyde monomers, with all monomers ranked according to their average H2O2 production rates. Figure 4c provides an enlarged view displaying the top ten amine monomers and top ten aldehyde monomers in the ranking, along with their corresponding structural labels. The top ten high-performance amine and aldehyde structures are shown in Fig. 4d,e. Among amine monomers, nitrogen-doped aromatic rings (A25, A26, A5, A21, A30 and A87) exhibit excellent performances in H2O2 photosynthesis. The high electronegativity and lone electron pairs of nitrogen atoms modulate the COF band structure, creating local asymmetry in electron density and enhancing material polarity, thereby promoting electron–hole pair separation53,54,55. Sulfonamide compounds (A34 and A33) with sulfone groups improve electron–hole pair separation and protonation, thereby increasing H2O2 production efficiency56. Quinone compounds (A68) feature highly conjugated π–electron systems that enhance light absorption, with quinone groups (C=O) acting as strong redox functional groups in photocatalytic reactions57. Fluorinated aromatic amines (A73) combine the functionalities of amine and fluorine atoms, optimizing band structures, enhancing light absorption and promoting charge separation58.
Aldehyde monomers include thiophene-based (B109, B16, B57 and B101), thiazole-based (B73, B70 and B117), long ether-chain-based (B106), pyridine-based (B3) and phenanthroline-based (B115). Thiophene-based monomers (B109, B16, B57 and B101) enhance light absorption through electron aggregation, aided by lone-pair electrons on sulfur atoms49, and triazine nitrogen atoms in B101 achieve similar effects. Thiazole-based monomers, such as B70 and B73, feature oxygen adsorption capabilities, reducing energy barriers and facilitating mass transfer59, while the benzothiazole group in B117 promotes electron–hole pair separation through its electron-withdrawing effect60. B106’s long ether-chain structure improves charge separation and transport by reducing interlayer stacking distances and forming a hydrogen-bonding network61. B3 and B115 contribute to the formation of ionic COFs, thus enhancing reaction kinetics62. Bipyridine-based COFs, including B3, show promise as photocatalysts through pyridine nitrogen protonation, accelerating reactions39,63. Similarly, the ionization of nitrogen atoms in B115 promotes the photosynthesis of H2O2 (ref. 39).
To analyse the impact of descriptors on the photocatalytic performances of COF structures in more detail, we used the Shapley Additive Explanations (SHAP)64 method to seek out the effect of structural, physics-informed information and reaction conditions descriptors. Figure 4f,g shows the SHAP summary plot and SHAP values of the model trained on the initial dataset split, revealing the influence of the top key descriptors on the model’s performance predictions. Results highlight the substantial influence of gas and sacrificial agent ratios and types, which are closely tied to the chemical principles of photocatalysis. Oxygen, a key reactant in H2O2 production, notably impacts photocatalytic performance, while sacrificial agents affect the efficiency of electron–hole pair transfer and determine reaction pathways and rates. The CB and VB positions are highly ranked, consistent with prior analyses, emphasizing the importance of physics-informed descriptors.
Among the structural features, the 750-bit molecular fragment, which consists of a benzene ring connected to a nitrogen-containing heterocycle, has the highest absolute SHAP value. This structure reduces the bandgap, enhances visible light absorption and promotes electron–hole pair separation while optimizing the adsorption and activation of target molecules. The 1,308-bit, 1,775-bit, 725-bit and 750-bit fragments consistently demonstrate the beneficial effects of nitrogen atom doping on the overall photocatalytic performance. Moreover, the 1,142-bit fragment represents a common trihydroxy trialdehyde structure, where the hydroxyl units may facilitate electron transfer, reduce electron–hole recombination and thereby enhance photocatalytic efficiency. By contrast, two connected benzene rings (a 683-bit fragment) exhibit symmetrical charge distribution, which hinders electron–hole pair separation and oxygen molecule adsorption, thereby limiting photocatalytic performance. Models trained on other dataset splits produced similar SHAP impact plots (Supplementary Fig. 15), further confirming the model’s stability and the relevance of selected descriptors in photocatalytic performance prediction.
High-throughput screening and experimental validation
Model prediction and validation were performed using a previously constructed COF dataset consisting of approximately 10,000 COF structures. Dimensionality reduction via t-distributed stochastic neighbour embedding (t-SNE) enabled us to visualize the structural diversity landscape of the constructed dataset in comparison with the collected experimental data. A broader distribution was observed for the constructed dataset. Most COFs exhibited relatively low predicted H2O2 yields, highlighting the challenges in designing high-performance COFs in this field (Fig. 5a). However, several promising regions were identified where potential COFs may exist. Our ensemble model not only makes precise predictions of H2O2 yield but also quantifies the associated prediction uncertainty (denoted as the standard deviation of ten separate models). A clear positive correlation was observed between the average predicted photocatalytic performance and the standard deviation (Fig. 5b,c), suggesting that COFs with higher predicted performance tend to exhibit greater uncertainty. This trend is plausible, as high-performance COFs often occupy sparsely populated regions of the design space, where the lack of similar structures inherently increases the uncertainty of their predictions. To balance predictive photocatalytic activity, diversity and availability, we selected and synthesized eight COF structures to validate our model (Supplementary Fig. 16). In particular, COF-343, COF-2449, COF-2835 and COF-8484 exhibited excellent performance that closely matched the model’s predictions, demonstrating its outstanding generalization capability in uncharted chemical space (Supplementary Fig. 17).

a, t-SNE distributions of the prediction database and literature database were obtained through dimensionality reduction using molecular fragment representations. b, The performance of the final prediction model was evaluated through 10-fold validation, and the average performance and corresponding standard deviation (s.d.) were calculated. c, The structures corresponding to the indices highlighted in b. d,e, Experimentally obtained and Pawley-refined XRD patterns, along with corresponding SEM images and structural schematics, for COF-343 and COF-8484. f, Comparison of photocatalytic H2O2 yield of COF-343, COF-2449, COF-2835 and COF-8484 with the state-of-the-art photocatalysts; the detailed structure and material information is listed in Supplementary Table 8. g, Comparison of predicted and experimental performances, illustrating the structure–activity relationship based on D–A pairing mechanisms. Predicted values are shown as mean ± s.d. (n = 10 independent predictions); experimental values are single measurements (shown without error bars). h, Comparison of prediction results from different models and experimental (Exp) results. Box plots summarize n = 10 independent predictions (centre line, mean; box, Q1–Q3; whiskers extend to 1.5× the interquartile range); points indicate individual predictions. The experimental result is presented as a single value. i,j, The SHAP force analysis plots for COF-343 (i) and COF-2450 (j).
Source data
Scanning electron microscopy (SEM) images show that COF-343 and COF-8484 adopt a rod-like morphology, whereas COF-2449 and COF-2835 form spherical structures (Fig. 5d and Supplementary Fig. 18). Powder X-ray diffraction (XRD) patterns exhibit sharp, intense peaks, indicative of high crystallinity (Fig. 5e and Supplementary Fig. 18), which is further examined by the high-resolution transmission electron microscopy (Supplementary Fig. 19). Brunauer–Emmett–Teller measurements indicate that these COF structures exhibit porous structure with large specific surface areas (Supplementary Fig. 20). The formation of imine linkages is confirmed by Fourier-transform infrared (FT-IR) and 13C solid-state nuclear magnetic resonance spectroscopy (Supplementary Figs. 21–23). X-ray photoelectron spectroscopy (XPS) validates the detailed elemental ratios and well-defined chemical structures of these COFs (Supplementary Fig. 24). Under standard testing conditions (Supplementary Fig. 25), COF-343 delivered a remarkable H2O2 production rate of 12,978.7 μmol h−1 g−1, exceeding nearly all COFs in the training set. COF-2835 (11,767.9 μmol h−1 g−1), COF-2449 (9,058.5 μmol h−1 g−1) and COF-8484 (6,431.9 μmol h−1 g−1) also exhibited excellent photocatalytic performance compared with the production rate of other COFs (Fig. 5f and Supplementary Figs. 26 and 27).
Notably, the COF-343 and COF-2449 retained approximately 90% of their initial photocatalytic activity over five consecutive reaction cycles (Supplementary Fig. 28). Their exceptional operational durability was further indicated by a long-term test (120 h), during which H2O2 was generated at a consistent rate (Supplementary Fig. 29). To assess structural integrity post-reaction, we characterized the recovered catalysts using XRD, FT-IR and XPS. The XRD patterns confirmed that the crystalline frameworks remained largely intact after photocatalysis (Supplementary Fig. 30). FT-IR and XPS analyses showed no substantial alteration in chemical states or bonding environments (Supplementary Figs. 31–34 and Supplementary Tables 6 and 7). Moreover, after 12-h immersion in H2O2 solutions of varying concentrations, both materials maintained their characteristic diffraction peaks, underscoring their inherent stability under oxidative conditions (Supplementary Fig. 35).
To further evaluate the accuracy and robustness of our model, we selected three structures from the high-performance (COF-343, COF-2449 and COF-460) and low-performance (COF-2385, COF-2341 and COF-2450) regions, respectively, for experimental testing on H2O2 photosynthesis. The strong agreement between the predicted yields and experimental validation demonstrates that our model exhibits superior capability in predicting both high- and low-performance photocatalytic COFs (Fig. 5g). As illustrated in the figure, these materials can be categorized into two distinct systems based on their D–A pairing mechanisms. (1) The D–A system (orange area) features COFs with a functional donor (aldehyde) and acceptor (amine) pair. Within this system, performance is effectively tuned by the acceptor strength, following the following trend: triazine (COF-343) > pyridine (COF-2449) > benzene (COF-460). (2) The A–A mismatch system (blue area) includes low-performance COFs that lack an effective donor. These materials pair an acceptor-type amine (A = pyridine) with an acceptor-type aldehyde (A′ = F-phenyl or pyridine). This A–A mismatch inhibits the D–A charge transfer pathway, resulting in consistently low photocatalytic activity.
Furthermore, we compared the predictions from three different models with the final experimental results (Fig. 5h). As the model improved, the predicted values gradually aligned with the experimental values. This trend further indicates that the cross-level feature fusion strategy has effectively improved predictive accuracy. The SHAP force analysis for COF-343 and COF-2450 (Fig. 5i,j) reveals how descriptors influence the increase or decrease of the dataset’s base value relative to the predicted values for each catalyst. The results indicate that the high-performance COF-343 exhibits a higher ratio of positive fragments in the thiophene group, while the low-performance COF-2450 displays a lower ratio of positive fragments in its nitrogen-containing groups, thus indicating that the ratio of positive fragments plays an essential role in determining their photocatalytic performances.