Genome-wide profiling of histone modifications in mouse embryonic stem cells
To systematically investigate the regulatory patterns of univalent and bivalent histone modifications, we compared the signal intensities and chromosomal distribution preferences of different histone marks. Among them, H3K4me3 displayed globally higher enrichment levels in mESCs compared to the two repressive modifications, H3K27me3 and H3K9me3. These marks were relatively evenly distributed across autosomes, while fewer peaks were observed on sex chromosomes, suggesting that the establishment of these modifications is largely stable across the genome (Fig. 1A). To further dissect the combinatorial patterns of H3K4me3 with either H3K27me3 or H3K9me3, we classified the peaks into monovalent, bivalent, and trivalent categories. The majority of peaks were marked by a single histone modification, while co-modified regions—those carrying two or more marks—constituted a smaller fraction of the total (Fig. 1B). Notably, regions simultaneously marked by H3K4me3, H3K27me3, and H3K9me3 (trivalent domains) accounted for approximately 1% of H3K4me3 peaks, 8% of H3K27me3 peaks, and 3% of H3K9me3 peaks.

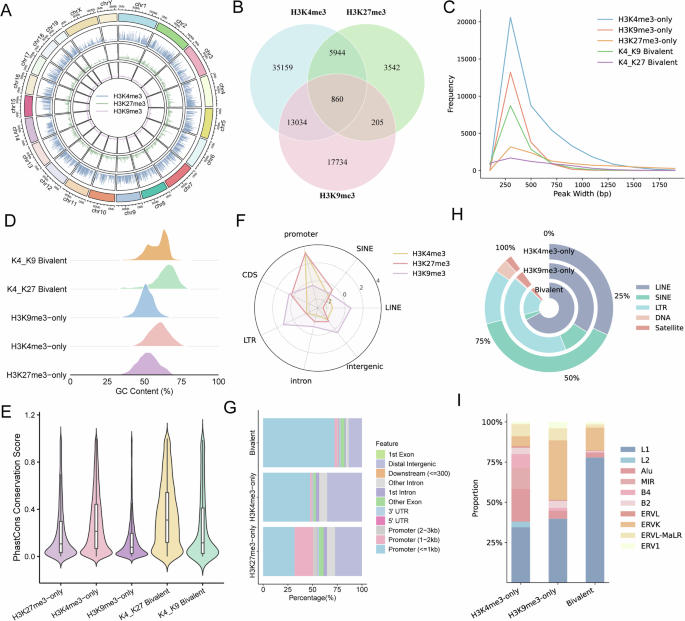
A Circos plot showing the H3K4me3, H3K27me3, and H3K9me3 peak signals across all chromosomes. B Venn diagram illustrating the genomic overlap among H3K4me3, H3K27me3, and H3K9me3 peaks. The observed three-way overlap is substantially higher than expected under a random genomic null model (mean ± SD = 2.7 ± 1.7; empirical p < 0.01), indicating a non-random co-occurrence of histone modification patterns. C Distribution of peak widths for monovalent (H3K4me3-only, H3K27me3-only, H3K9me3-only) and bivalent modifications. D GC content distribution of genomic regions associated with different histone modifications. E PhastCons conservation scores for monovalent and bivalent peaks, reflecting evolutionary constraint. F Radar plot showing enrichment score (log ratio of observed/random) of H3K4me3, H3K27me3, and H3K9me3 peaks across various genomic elements, including promoters, coding sequences (CDS), introns, intergenic regions, and major transposable element (TE) classes (LINE, LTR, and SINE). G Genomic annotation of H3K4me3-only, H3K27me3-only, and bivalent peaks across functional features (e.g., promoters, exons, introns, downstream regions). H Proportional overlap of histone modification peaks with major TE classes, including LINE, SINE, LTR, DNA, and satellite elements. I TE family composition (e.g., L1, B2, ERVK, and Alu) associated with H3K4me3-only, H3K9me3-only, and bivalent peaks.
We next investigated the underlying DNA sequence characteristics of monovalent versus bivalent peaks, focusing on peak width, GC content, and conservation. Peak length analysis revealed that most regions spanned 200 to 1000 bp, with bivalent peaks being slightly narrower than monovalent ones (Fig. 1C). Additionally, bivalent peaks exhibited significantly higher GC content and conservation scores, suggesting that these co-modified regions are preferentially located in conserved genomic elements (Fig. 1D, E).
Bivalent domains are typically found at promoter regions, as exemplified by the overlap of H3K4me3 and H3K27me3 enrichment at gene promoters (Fig. 1F, G). In contrast, H3K9me3 showed predominant enrichment within long terminal repeat (LTR) and long interspersed nuclear element (LINE) repetitive elements (Fig. 1F), consistent with its established role in retrotransposon silencing29. We also evaluated the enrichment of repetitive DNA elements within H3K9me3/H3K4me3 bivalent domains. The results showed that H3K9me3-marked bivalent regions were significantly enriched in repetitive elements in mESCs, with H3K9me3/H3K4me3 domains particularly enriched for LINE/L1 elements (Fig. 1H, I).
Bivalent modifications coordinately regulate gene expression
To elucidate the effects of distinct histone modification (HM) patterns on gene expression, we quantitatively assessed the signal intensities of H3K4me3, H3K27me3, and H3K9me3 at trivalently marked genes and correlated these with corresponding transcriptional levels. Our analysis revealed that elevated H3K4me3 signals are strongly associated with high gene expression, whereas enrichment of H3K27me3 or H3K9me3 correlates with reduced expression. These findings suggest that within co-marked genomic regions, H3K4me3 likely functions as the principal activation mark, while H3K27me3 and H3K9me3 appear to contribute predominantly to repressive regulatory outcomes (Fig. 2A).

A Heatmap showing the Z-score-normalized signal intensities of H3K4me3, H3K27me3, and H3K9me3, along with expression levels of co-marked genes in mESCs. B Gene expression levels (log₂(FPKM + 1)) associated with the four chromatin states. n = number of genes; two-sided Wilcoxon rank-sum test. C Bivalent histone modification RPM signals across bivalent genes with low, medium, or high expression levels. n = number of genes; two-sided Wilcoxon rank-sum test. D Kyoto Encyclopedia of Genes and Genomes (KEGG) pathway enrichment of highly expressed bivalent genes (FDR < 0.05). E Nine-quadrant scatter plot of Z-score-normalized H3K4me3 and H3K9me3 signals at overlapping peaks, showing four chromatin groups based on signal levels: High-High, Mid-High, High-Mid, and Mid-Mid. F Gene expression levels associated with the signal-defined chromatin groups in Fig. 2E. G GO biological process (BP) enrichment of H3K4me3/H3K9me3 High-High bivalent genes (FDR < 0.05).
We further analyzed the expression patterns of genes associated with the two types of bivalent modifications (H3K4me3/H3K27me3 and H3K4me3/H3K9me3), and performed functional enrichment analyses. Genes marked by H3K4me3/H3K27me3 bivalency exhibited relatively low expression levels, falling between those marked by H3K4me3-only and H3K27me3-only regions, but skewed closer to the H3K27me3-only profile, indicating a general tendency toward transcriptional repression (Fig. 2B). We further categorized bivalent genes into high, medium, and low expression groups and observed a positive relationship between bivalent mark intensity and gene expression, with highly expressed genes showing the strongest bivalent signals (Fig. 2C). Consistently, a genome-wide correlation analysis revealed a weak but statistically significant positive association between bivalent signal intensity and gene expression (Spearman’s ρ = 0.186, p = 9.33 × 10−³⁴; Supplementary Fig. S1), in agreement with previous studies30,31. KEGG pathway enrichment analysis of highly expressed bivalent genes revealed significant association with the “breast cancer” pathway, implying that some bivalent genes may contribute to oncogenesis. For example, the bivalent gene POU4F1 has been shown to be essential for promoting and sustaining basal-like breast cancer (BLBC), making it a potential therapeutic target32 Bivalent genes are enriched in majority of the signaling pathways related to the pluripotent maintenance and development, such as signaling pathways regulating pluripotency of stem cells, TGF-beta, Wnt, MAPK, FoxO and Hippo signaling pathways33 (Fig. 2D).
Next, we attempted to define bivalent genes with different signal intensities by overlapping H3K4me3 and H3K9me3 Chromatin Immunoprecipitation sequencing (ChIP-seq) peaks. The overlapping regions were categorized into four groups based on signal strength: High-High, Mid-High, High-Mid, and Mid-Mid. These groups exhibited a linear distribution pattern, suggesting a certain degree of co-regulation between H3K4me3 and H3K9me3 (Fig. 2E). By integrating RNA-seq data, we found that genes located in regions with both high H3K4me3 and high H3K9me3 signals (High-High) exhibited relatively low expression levels (Fig. 2F). Bivalent domains are known to undergo dynamic transitions during cell fate specification. For instance, changes in bivalent marks are implicated in the differentiation of neural stem cells34. Gene Ontology (GO) analysis of H3K4me3/H3K9me3-associated genes revealed enrichment in neurodevelopmental processes such as synapse assembly—a critical step during ESC differentiation into mature and functional neurons (Fig. 2G).
Interpretable model of bivalent histone modifications driven by sequence features
In embryonic stem cells, bivalent domains marked by H3K4me3 and H3K27me3 are preferentially enriched at promoters containing CpG islands3 and exhibit strong associations with specific DNA sequence features, such as CpG-rich elements and transcription factor binding sites35. A previous study identified an enrichment of the TCCCC sequence motif at bivalent promoters in both mouse and human ESCs36. Nevertheless, the sequence determinants that encode or direct the formation of bivalent histone modifications remain largely elusive. To explore whether bivalent chromatin regions harbor unique and predictive sequence features, we employed five supervised machine learning algorithms as well as deep learning models to classify bivalent versus monovalent regions. Specifically, overlapping bivalent peaks (200-1000 bp in length) were selected for sequence feature extraction. For machine learning models, we used the widely adopted k-mer approach, which has proven effective in capturing short sequence patterns relevant to chromatin state21. Insights from previous research were leveraged to guide the selection of parameter k, and a range of k values from 3 to 8 was adopted in this study19,37,38. For deep learning models, sequences were encoded using one-hot encoding, enabling the models to automatically learn latent sequence patterns (Fig. 3).

This diagram summarizes the computational workflow employed in this study. First, genomic regions marked by H3K4me3, H3K27me3, and H3K9me3 were extracted and transformed into numerical representations using either k-mer features or one-hot encoding. Next, a suite of machine-learning models (logistic regression, SVM, random forest, XGBoost, and neural networks) and deep-learning architectures (DanQ, DeepSEA, CNN+Attention, and CNN+Transformer) were trained to distinguish bivalent from non-bivalent sequences. Model performance was assessed using accuracy, AUROC, AUPRC, sensitivity, precision, and F1-score. Finally, motifs learned by the deep models were interpreted via activation mapping and visualized through motif logos and transcription-factor interaction networks.
We first constructed a three-class classification model to distinguish among H3K4me3-only, H3K9me3-only, and H3K4me3/H3K9me3 bivalent regions. Based on comparative analysis between Lasso regression and Random Forest for feature selection, we adopted Random Forest, which identified 797 informative 6-mer features (Supplementary Fig. S2). Evaluation across different k-mer sizes revealed that all models performed best at k = 6 (Fig. 4A), consistent with prior machine learning studies on genomic sequence prediction18,20,39,40. Among all models tested, Support Vector Machine (SVM) yielded the highest classification performance, as indicated by ROC curves and overall accuracy (Fig. 4B, C). The confusion matrix of the SVM model confirmed strong classification capacity, particularly for H3K4me3-only regions (Fig. 4D). To exclude the possibility that the observed predictive performance arose from random correlations, we further evaluated a randomized null model in which sequence features were shuffled while class labels were preserved. Under this control, all models exhibited chance-level performance (AUROC ≈ 0.5), in contrast to the clear diagonal enrichment observed when using real genomic sequences (Supplementary Fig. S5), indicating that the predictive signals captured by the models are genuinely encoded in DNA sequence features. Using a similar strategy, we further distinguished H3K4me3/H3K27me3 bivalent regions from monovalent ones. Lasso regression was used to select 616 relevant sequence features. Optimal model parameters were determined via grid search with 5-fold cross-validation. Among all tested classifiers, the XGBoost-6mer model achieved the best predictive performance (Supplementary Fig. S3). Interestingly, H3K4me3/H3K9me3 bivalent regions were classified more accurately than H3K4me3/H3K27me3 regions, indicating that they may harbor more distinct sequence determinants.

A Prediction test set accuracy of different machine learning models (SVM, Random Forest, XGBoost, Logistic Regression, Neural Network) across various k-mer sizes (3-mer to 8-mer) in classifying H3K4me3-only, H3K9me3-only, and bivalent regions. B ROC curves illustrating the performance of each model on the test set in distinguishing bivalent from monovalent (H3K4me3 or H3K9me3) regions. C Radar plot summarizing precision, recall, F1 score, and accuracy for each machine learning model on the test set. D Confusion matrix of the SVM classifier showing prediction performance across three classes: H3K4me3-only, H3K9me3-only, and bivalent. E ROC curves of test set predictions using models trained on four representative enriched sequence features derived from bivalent regions. F SHAP-based feature interpretation of the Random Forest model, indicating the contribution of four specific sequence features (k-mers) to distinguishing bivalent, H3K4me3-only, and H3K9me3-only regions. G AUROC performance of deep learning models (DeepSEA, DanQ, CNN+Attention, CNN+Transformer) trained on input sequences of varying lengths (200–1000 bp). H Comparison of AUROC and AUPRC scores of deep learning models using 600 bp input sequences. I Radar chart summarizing overall performance metrics (accuracy, precision, sensitivity, F1 score, AUROC, and AUPRC) of deep learning models on the test set.
Given the large number of sequence features identified by machine learning, model interpretation remains challenging due to feature complexity and potential redundancy. To address this, we performed HOMER enrichment analysis to prioritize core sequence motifs with potential biological relevance (Supplementary Fig. S6B). For the H3K4me3/H3K9me3 bivalent modifications, four key motifs were significantly enriched. We retrained classification models using only these core features and observed that all models maintained robust predictive performance, with AUC values reaching approximately 0.87. Among them, the Random Forest (RF) model consistently outperformed others, suggesting that these core sequence motifs are sufficient to capture essential information for chromatin state classification (Fig. 4E). SHAP (SHapley Additive exPlanations) analysis revealed that the motif “TCTGAA” exhibited the highest positive contribution to the prediction of bivalent regions, indicating its strong association with bivalent chromatin states. In contrast, the remaining three motifs predominantly contributed to the classification of H3K9me3-only regions. These findings suggest functional divergence among sequence motifs, where distinct short DNA sequences preferentially mark different histone modification states (Fig. 4F). These findings indicate that different short DNA motifs preferentially associate with distinct chromatin states.
Similarly, five enriched motifs were identified for H3K4me3/H3K27me3 bivalent domains. As expected, the performance was slightly reduced compared to models trained with the full feature set, yet the simplified model offers improved interpretability and highlights biologically relevant sequence patterns (Supplementary Fig. S4). Based on SHAP values, the motifs TCACAG, TTCAAA, and AGGGCT exhibited the highest feature importance, serving as key indicators for distinguishing H3K4me3/H3K27me3 bivalent regions from monovalent counterparts (Supplementary Fig. S4C). Collectively, these results highlight that specific short DNA sequence motifs not only carry predictive power for chromatin state classification but also provide mechanistic insights into the sequence determinants underlying bivalent histone modifications.
To gain deeper insights into the sequence determinants regulating bivalent chromatin regions, we constructed deep learning models to predict H3K4me3/H3K9me3 bivalency. We systematically evaluated the effect of different input sequence lengths (200 bp, 400 bp, 600 bp, 800 bp, and 1000 bp) on model performance. Overall, most models exhibited improved AUROC values with increasing sequence length. Specifically, the DanQ, CNN+Attention, and CNN+Transformer models achieved optimal performance when trained on sequences of 600 bp or 1000 bp (Fig. 4G), suggesting that these lengths are well-suited for this binary classification task. Among all evaluated models, the CNN+Attention architecture consistently demonstrated the best predictive performance, followed by the DanQ and CNN+Transformer models, based on comprehensive evaluation metrics (Fig. 4H, I). These results suggest that deep learning models are capable of capturing higher-order and context-dependent sequence features relevant to bivalent chromatin, with interpretable architectures further facilitating motif discovery.
Analysis of sequence regulatory grammar underlying bivalent histone modifications
To elucidate the regulatory grammar of distinct bivalent histone modifications, we performed a comparative analysis of sequence features associated with H3K4me3/H3K9me3 and H3K4me3/H3K27me3 regions. Histone modification level was reported to be closely related to the overall GC content of the corresponding region41, we categorized the identified motifs into three groups based on their GC content: GC-rich, AT-rich, and neutral motifs. Most motifs were GC-rich, while a smaller proportion were AT-rich (Fig. 5A). Previous studies have implied the role of particular DNA sequences (or motifs) in setting the boundary of histone modification domain or opening chromatin to allow remodeling enzymes to bind DNA42. We next examined the positional distribution of the selected motifs within bivalent sequences. Each bivalent region was divided into ten equal bins, with the outermost bins representing the edges and the central bins representing the center. We observed that motifs associated with H3K4me3/H3K27me3 bivalency were predominantly enriched at the edges of bivalent regions, whereas those linked to H3K4me3/H3K9me3 bivalency were largely classified as neutral. These results indicate that the two types of bivalency exhibit distinct motif positional preferences within bivalent domains (Fig. 5B; Supplementary Fig. S6A).

A Grouped bar plot showing the number of GC-rich and AT-rich 6-mer motifs identified in H3K4me3/H3K9me3 and H3K4me3/H3K27me3 regions. B Pie charts showing the positional preferences of motifs (central, edge, neutral; details in Motif Analysis) within bivalent peaks. C UpSet plot of bivalent genes associated with four enriched motifs in H3K4me3/H3K9me3 regions. D Chord diagram showing motif-gene associations in H3K4me3/H3K9me3 regions. E Bubble plot of transcription factors significantly enriched for the four representative motifs. F Boxplot of information content (IC) scores for motifs identified by CNN+Attention, CNN+Transformer, DanQ, and DeepSEA models. G Heatmap of transcription factor matches for motifs predicted by each deep learning model. H KEGG pathway enrichment analysis of bivalent genes associated with DanQ-predicted motifs (FDR < 0.05).
Next, we further investigate potential transcription factors (TFs) associated with these sequence features, we used the TomTom tool to compare all identified motifs with a mouse motif database. Pluripotency-related transcription factors, including STAT3, ESRRB, KLF4, OCT4, SOX2, and SMAD1, were significantly enriched in both types of bivalent regions (Supplementary Fig. S6), suggesting shared regulatory programs in embryonic stem cells. Notably, the key motif TCTGAA that distinguishes H3K4me3/H3K9me3 bivalent regions was primarily matched to the TF TCFCP2l1 (Fig. 5E). These findings suggest that the DNA sequences co-occupied by H3K4me3/H3K27me3 or H3K4me3/H3K9me3 are potentially regulated by pluripotency factors in embryonic stem cells. We further mapped the identified sequence features of H3K4me3/H3K9me3 bivalent modifications to specific peak regions, annotated the corresponding genes, and identified four bivalent genes containing all four key motifs (Fig. 5C, D). These peaks exhibited intermediate ChIP-seq signal intensities between H3K4me3-only and H3K9me3-only regions (Supplementary Fig. S6E), supporting the notion of a distinct chromatin state.
To interpret the learned sequence patterns, we applied a sequence alignment-based interpretability method (SABM) to H3K4me3/H3K9me3-labeled regions. This method identifies subsequences that activate convolutional neurons and stacks position weight matrices (PWMs), analogous to traditional estimation methods43. We used information content (IC) to evaluate each model’s ability to identify functional sequence motifs, with the DanQ model achieving the highest IC values, indicating stronger motif definition in this subtype (Fig. 5F). Using the TOMTOM tool, we identified the transcription factors associated with motifs learned by different models. These transcription factors are capable of binding not only to the promoters of pluripotency-related genes in embryonic stem cells, but also to their enhancer regions, thereby maintaining the pluripotent state (Fig. 5G). Subsequently, we applied the FIMO tool to locate the specific positions of each motif (motif sites), and annotated the corresponding bivalent genes. KEGG pathway enrichment analysis of these bivalent genes revealed significant enrichment in the Neuroactive ligand–receptor interaction pathway, which is closely associated with nervous system development and stem cell differentiation (Fig. 5H).
In summary, while H3K4me3/H3K9me3 and H3K4me3/H3K27me3 bivalent regions share common pluripotency-related regulatory factors, they differ in base composition, motif positioning, TF specificity, and associated biological pathways. These findings suggest that distinct sequence grammars underlie the two classes of bivalent chromatin, reflecting their divergent regulatory roles in embryonic stem cells.