Study design and population
This study was approved by the ethical review body of the First Affiliated Hospital of Shandong University of Traditional Chinese Medicine in accordance with the Declaration of Helsinki, and informed consent was obtained from the participants. Inclusion criteria for this study were AIS patients aged 30 to 80 who were continuously hospitalized within 7 days of symptom onset between January 2022 and November 2023. Management and evaluation of all observed samples were performed in accordance with institutional stroke protocols and related guidelines. According to China’s Guidelines for Diagnosis and Treatment of AIS 201814the diagnostic criteria for AIS were set as follows. (1) Acute onset. (2) focal neurological deficits (e.g., weakness or numbness on one side of the face or limbs, speech impairment); A minority manifest as a comprehensive neurological disorder. (3) Imaging evidence of a causative lesion or symptoms/signs that persist for more than 24 hours. (4) Exclusion of nonvascular causes. (5) Confirmation that there is no cerebral hemorrhage by brain CT or MRI. The primary endpoint was defined as the onset of post-stroke cognitive impairment (PSCI) within 3 to 6 months after stroke onset. Cognitive function was assessed in patients diagnosed with stroke within the past 3–6 months. PSCI was determined based on the following thresholds: MMSE score ≤ 17 points (illiterate individuals), ≤ 20 points (primary education level), or ≤ 24 points (secondary education level or above), or MoCA score ≤ 26 points.7,15. Additionally, patients with the following characteristics were excluded from the study: (1) previous diagnosis of cognitive impairment; (2) history of psychotropic drug dependence and other substance abuse; (3) If the person has severe visual, hearing, language, or consciousness impairments and is unable to fully cooperate with the investigation. (4) Patients who quit during the interview. After applying strict inclusion and exclusion criteria, we enrolled a total of 526 patients diagnosed with AIS. After excluding 7 samples with data loss, 12 samples with abnormal test data due to temporary findings or confounding bias during the test process that could change the distribution of data, and 13 samples with severe cognitive impairment (MMSE score or MOCA score <18 score)16In this study, 494 samples were ultimately included in model development.
Sample size calculation
According to a previous report, the prevalence of PSCI 6 months after AIS outbreak in China was 34.2%.9. Using α = 0.05, β = 0.10, δ = 0.05, Zβ= 1.282,Zα= 1.960, and n =[(Zβ + Zα)/δ]2× π0× (1−π0). Based on the estimation formula, the required minimum sample size was determined to be 346 patients. Considering that several patients were lost to follow-up or dropped out of the study, the final number of patients included was 494.
Screening variables
A total of 49 parameters were collected: general information at admission (n = 11), imaging parameters (n = 15) and laboratory indicators (n = 16), medication information (n = 3) and related scale indicators (n = 4). Specifically, the data includes general information such as gender, age, educational background, marital status, occupation, smoking, alcohol consumption, hypertension, coronary heart disease (CHD), diabetes, and hyperlipidemia. Data on imaging indicators such as frontal lobe lesions, parietal lobe lesions, occipital lobe lesions, temporal lobe lesions, basal ganglia lesions, paraventricular lesions, brain lesions, cerebellar lesions, thalamic lesions, pontine lesions, brainstem lesions, corona radiata lesions, central hemisphere lesions, number of lesions, and lesion surface. Data on laboratory indicators including white blood cell count (WBC), absolute neutrophil count (ANC), red blood cell count (RBC), red blood cell distribution width (RDW), alanine transaminase (ALT), aspartate transaminase (AST), albumin (ALB), serum creatinine (SCr), serum uric acid (SUA), fasting blood glucose (FBG), triglycerides (TG), total cholesterol (TC), high-density lipoprotein cholesterol (HDL-C), low-density lipoprotein cholesterol (LDL-C), apolipoprotein A1 (APOA1), and apolipoprotein B (APOB). Data on scale indicators such as NIHSS, PSQI, Hamilton Depression Scale (HAMD) – 24, Barthel. Data on drug information such as antihypertensive, lipid-lowering, and hypoglycemic drugs. This study identified key variables for the development and validation of a predictive ML model for PSCI through a rigorous two-step feature selection process. First, variables were selected based on least absolute shrinkage and selection operator (LASSO) penalty with 10-fold cross validation. The optimal regularization parameter λ was determined by a grid search over the range λ. ∈ [0.001, 0.01, 0.1, 1, 10]the final value is selected based on the minimum cross-validation error. This approach ensures that the most relevant predictor variables are selected while minimizing overfitting. Subsequently, the influence of these variables on PSCI was further evaluated using univariate and multivariate logistic regression (LR) models to confirm their statistical significance and clinical relevance. Through this combined approach, nine key variables were ultimately identified and incorporated as predictors for the development of a predictive model. This feature selection methodology, which integrates LASSO regularization and logistic regression analysis, ensures the robustness and interpretability of the selected predictors, in line with best practices in predictive modeling.
PSCI ML model development and interpretability
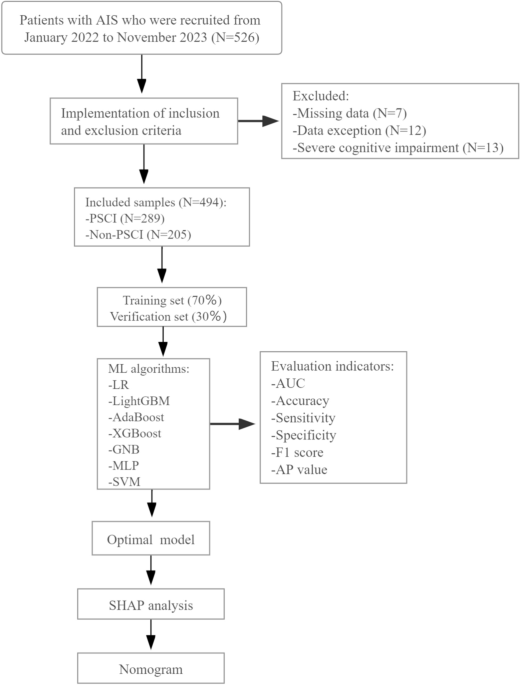
Figure 1 shows the model development process. To create a balanced dataset, all observed samples were randomly split into 70% for training and 30% for validation, maintaining a 7:3 ratio. We employed 10-fold cross-validation for model selection and hyperparameter tuning, as this approach reduces the risk of overfitting the model to certain subsets of the data. To comprehensively evaluate the predictive performance of post-stroke cognitive impairment (PSCI), seven ML algorithms were implemented with parameter configurations optimized through grid search and 10-fold cross-validation. Specific hyperparameter details for each model are as follows. ① Extreme Gradient Boosting (XGBoost) classifier: L2 regularization factor (reg_lambda): 0.5, minimum child weight threshold for splitting (min_child_weight): 2, maximum tree depth (max_Depth): 4, learning rate (learning_rate): 0.3. ② LR: Convergence tolerance (tol): 0.0001, Regularization type (penalty): L2 norm, Regularization strength (C): 0.01, Maximum number of iterations (max_iter): 100; ③ Light Gradient Boosting Machine (LightGBM): Number of leaves per tree (num_leaves): 100, maximum tree depth (max_Depth): 20, number of boosting rounds (n_estimators): 5, learning rate (learning_rate): 2.0. ④ Adaptive boosting (AdaBoost): Number of weak learners (n_estimators): 50, learning rate reduction (learning_rate): 0.3. ⑤ Gaussian Naive Bayes (GNB): variance smoothing factor (var_smoothing): 1e−7; ⑥ Multilayer Perceptron (MLP): Hidden layer dimensions (hidden_layer_sizes): (30, 30), Activation function (activation): Logistic sigmoid, Maximum number of training iterations (max_iter): 10;⑦ Support Vector Machine (SVM): Convergence Tolerance (TOL): 0.001, Kernel: RBF, Penalty Parameter (C): 1.0. Defining the best predictive model is based on multiple evaluation metrics. For each model, the area under the receiver operating characteristic curve (AUROC) was calculated using 10-fold cross-validation. Higher AUROC values indicate better discriminatory ability, and values closer to 1 indicate better ability to distinguish between PSCI and non-PSCI patients. In addition to AUROC, other metrics such as sensitivity, specificity, accuracy, F1 score, and average precision (AP) were also considered. Models that consistently perform well across all these metrics are considered the most predictive. To better understand the performance of the optimized XGBoost model, we conducted a SHAP (Shapley additive exPlanations) analysis. SHAP provides a comprehensive account of how each feature contributes to the model’s predictions and quantifies the impact of each on the predicted PSCI probability for individual patients. The analysis revealed a significant contribution of the predictive function. Moreover, the contribution of characteristics varies among patients, reflecting individual differences in PSCI risk factors.

Study registration and model development process. Abbreviations: PSCI: Post-stroke cognitive impairment; LR: Logistic Regression, XGBoost: Extreme Gradient Boosting, LightGBM: Optical Gradient Boosting Machine, AdaBoost: Adaptive Boosting, GNB: Gaussian Naive Bayes, MLP: Multilayer Perceptron, SVM: Support Vector Machine. AUC: Area under the curve. AP: Average precision. SHAP: Shapley additive description.
statistical calculation
This study used Python 3.7 and R 3.6.3 for all statistical analyzes and visualizations. Normally distributed continuous data were expressed as mean ± standard deviation (SD) and compared using Student’s t test. Non-normal continuous data were expressed as median [IQR]were compared using the Mann-Whitney U test. Categorical data were measured as frequencies or percentages and compared using the chi-square test or Fisher’s exact test. All continuous variables were standardized to have a mean of 0 and a standard deviation of 1 to ensure comparability between features and facilitate the regularization process. A LASSO penalty and LR model were used to simplify the number of variables modeled. For the LASSO penalty model, a 10-fold cross-validation method was used to obtain the LASSO penalty coefficient and cross-validation curve, and the corresponding modeling variables were screened by setting the minimum distance standard error λ. In the LR model, univariate and multivariate LR analyzes were performed to screen the important influencing factors of PSCI. Adjusted covariates included marital status, smoking status, diabetes, frontal lobe lesions, parietal lobe lesions, temporal lobe lesions, WBC, ALT, APOA1, and Barthel Index. Additionally, we applied false discovery rate (FDR) corrections to all statistical tests to address the issue of multiple testing and control the risk of false positives. Specifically, using the Benjamini-Hochberg procedure, P– Values for both univariate and multivariate analysis. The FDR threshold was set as follows: P< 0.05 ensures that the false positive rate is controlled to 5%. fixed P-value (written as “”)P-value_FDR”) were explicitly reported in the results section and table, along with the uncorrected results. P-value. Allow readers to comprehensively assess the significance of your findings. Seven ML algorithms were used to develop the predictive model for PSCI, including LR, XGBoost, LightGBM, AdaBoost, GNB, MLP, and SVM, and the model was rigorously validated internally through bootstrapping validation techniques. Decision curve analysis (DCA) was performed to determine the net benefit at each threshold probability. SHAP analysis and nomograms provide a visual and interpretable approach to determining the optimal ML model for PSCI. Statistical significance was considered significant at the 0.05 level, and all tests were performed using two-tailed analyses.