The study protocol was approved by the School of Veterinary Medicine and Animal Science (University of São Paulo State–UNESP) Ethical Committee for the Use of Animals in Research (Approval number, 0147/2018). Human ethics approval was not applicable. The bulls were part of another experiment investigating the influence of testicular warming followed by castration, used to validate two pain scales12. Respecting the three R’s (reduce, replace and refine), the perioperative pain assessment in-person observations and video recordings dataset of these patients were used in the previous clinical prospective studies.
All methods were performed in accordance with the relevant guidelines and regulations and in accordance with the COSMIN24,25 and ARRIVE26 guidelines adapted to the experimental design.
Animals received intravenous xylazine (0.05 mg/kg) as premedication, followed by induction of anesthesia with intravenous diazepam (0.05 mg/kg) and ketamine (2.5 mg/kg), and maintenance with isoflurane. Additionally, flunixin meglumine (1.1 mg/kg) was administered intramuscularly and xylazine (0.05 mg/kg diluted into 20 mL of saline 0.9%) was administered via sacrococcygeal epidural at induction of anesthesia. The total duration of anesthesia was 5 h 43 ± 32 min. Before surgery the testicles were submitted to thermal warming with progressively increasing temperatures ranging from 34 to 40 C, each maintained for 45 min, as part of the experimental protocol Subsequently, a bilateral scrotal incision was performed to conduct orchiectomy using the closed technique. Post-operative analgesia was performed with 0.1 mg/Kg of morphine intramuscularly and, when necessary, dipyrone for rescue analgesia. Flunixin meglumine was administered daily for three days after surgery.
Video data collection
The dataset utilized in this study consists of about 3 min video recordings of Bos taurus (Angus) and Bos indicus (Nelore) bulls was obtained from a previous study12. A total of 20 bulls (10 Nelore and 9 Angus) were initially recorded at five different time points. However, footage from one animal was omitted because it received a different postoperative treatment protocol, and videos of two additional animals were excluded due to insufficient illumination during nighttime recording. Consequently, the final dataset included 17 bulls, resulting in 34 valid videos (17 bulls\(\times\)2 time points, 2 observers scoring UCAPS and BGS), each with a duration of 3 min. Examples of frames extracted from dataset are depicted in Fig. 1.

Examples of frames from dataset: left: Bos taurus (Angus), right: Bos indicus (Nelore).
The recordings were conducted at the following time points:
-
M0: 48 hours before surgery and prior to fasting.
-
M1: Preoperative, before sedation, during fasting (48 h after M0).
-
M2: Three hours after sternal recumbency following surgery, before analgesia.
-
M3: One hour after administration of intramuscular morphine (0.1 mg/Kg) as postoperative analgesia.
-
M4: 24 hours after surgery, prior to the final administration of analgesics.
The videos were recorded using a Canon PowerShot SX50 HS camera (Oita, Japan) mounted on a tripod positioned 1–2 m outside the animal enclosure. Each recording was conducted without interruption or editing to ensure the preservation of natural behavior.
For the pain identification process using the deep learning model, only M1 and M2 time points data was used for calculations of in-person assessments and videos . According to that two classes were considered for ground truth: No Pain (the preoperative M1) and Pain (immediate postoperative M2). These time points were chosen to capture behavioral changes indicative of pain, with M1 serving as a baseline and M2 reflecting the acute pain response after surgery. The collected video data played a crucial role in training and validating the model, enabling the objective assessment of bovine pain behaviors.
Pain recognition by humans
The initial human assessment methodology employed the Bovine Grimace Scale (BGS), a proposed facial expression scoring system using the facial action units of the Bovine Pain Face27, complemented by action units of the “Sheep Grimace Scales”28,29 and the “Horse Grimace Scale”30. The last scale evaluates five distinct facial regions utilizing a three-point scoring system (0 = absent, 1 = moderately present, 2 = distinctly present). The evaluated facial features comprise: orbital tightening, tension above the eyes, masseter muscle tension, ear positioning (both frontal and lateral aspects), labial-mandibular configuration, and modifications in nostril or muzzle morphology. The cumulative pain score is calculated through the summation of individual scores across seven assessment areas, with a maximum attainable score of 14 (corresponding to a score of 2 for each facial region, including both lateral and frontal ear positioning evaluations) (see Table 1).
A specific limitation of this study design was the absence of a pre-study training phase for the BGS. Unlike the validated UCAPS (described below), the BGS was not yet validated at the time of data collection, and no standardized training dataset was available, so no previous training could be performed performed for BGS. The BGS score to define “pain” and “no pain” was calculated following the methodology used in previous studies of UCAPS12,13. The time points M1 (pre-surgery, pain-free bulls) and M2 (post-surgery, pain) were used to determine the cut-off value. Before scoring the scales, observers assessed each bull and answered whether, based on their clinical experience, they would administer rescue analgesia. The cut-off point was determined using the Youden Index (YI = [Sensitivity + Specificity] – 1), identifying the threshold that maximized both sensitivity (true positives: number of bulls in M2 judged to require analgesia / total number of bulls) and specificity (true negatives: number of bulls in M1 judged not to require analgesia / total number of bulls). Based on this calculation, the cut-off score was 5, with a sensitivity of 0.76, specificity of 0.85, and a Youden Index of 0.62.
The main assessment protocol used as a ’gold standard’ reference for comparison against deep learning was the UNESP-Botucatu Cattle Pain Scale (UCAPS), a validated body behavioral scoring system12,13 designed for postoperative pain evaluation in cattle. This instrument implements a variable scoring scale encompassing multiple behavioral categories: locomotion, interactive behavior, appetite, and miscellaneous behavioral indicators. Each variable is assessed using an ordinal scale with three descriptive levels, where zero represents normal behavior, and scores of one or two indicate pain-related behavioral modifications. The comprehensive assessment yields a maximum possible score of 10 points, with an established analgesic intervention threshold of 4 points12. This pain scoring instruments12,13 is published in open-access journals, under the Creative Commons license (for the UCAPS: http://creativecommons.org/publicdomain/zero/1.0/ and UCAPS behaviours may be assessed in https://animalpain.org/en/home-en/ and Vetpain application avalailable for Android (https://play.google.com/store/apps/details?id=com.vetpain.app) e IOS (https://apps.apple.com/ca/app/vetpain/id6462712970).
To ensure validated human scoring for a fair comparison with machine learning performance, the UCAPS dataset scores were obtained from our previous study31, which detailed the observer training protocol. This protocol included an initial comprehensive review of the UCAPS scale items and usage guidelines, during which videos exemplifying each behavior were reviewed and discussed to promote scoring consistency using an online platform (https://animalpain.org/en/boisdor-en/). This was followed by a second training session, in which observers scored ten randomized videos depicting the perioperative period of surgical castration in one Nelore and one Angus bull. After each video, their scores were compared and discussed whenever discrepancies occurred.
Two independent anesthetists, scored BGS (in-person) and UCAPS (both in person and by videos recorded simultaneously). It is important to note the difference in blinding between these modalities. For real-time (in-person) assessments, observers were present during the procedure and therefore aware of the surgical time point (unblinded). In contrast, video-based assessments were performed six months later by the same observers, who were fully blinded to the time points, and the order of video observation was randomized. Video-recorded pain assessments were performed six months after the real-time evaluations by the same observers. Each evaluator reviewed the videos individually using separate computers and assessed them in the same randomized order. After watching each video, evaluators completed data collection following the same sequence used during the real-time assessments.
Two independent anesthetists scored BGS and UCAPS in person, simultaneously with the video recordings. Video-recorded pain assessments were performed six months after the real-time evaluations by the same observers. Evaluators were blinded to the time points, and the order of video observation was randomized. Each evaluator reviewed the videos individually using separate computers and assessed them in the same randomized order. After watching each video, evaluators completed data collection following the same sequence used during the real-time assessments.
Inter-observer reliability showed kappa reasonable agreement for BGS (0.375; 95% confidence interval 0.094–0.655)32, good reliability for UCAPS real-time (0.765; 95% confidence interval 0.013–0.646), and reasonable agreement for UCAPS video-based assessment (0.330; 95% confidence interval 0.550–0.980), with each observer performing each scoring only once on a single phase.
A total of 68 observations were collected (17 bulls\(\times\)2 time points (M1 or M2)\(\times\)2 observers). For moving from scoring to recognition (class Pain/No Pain), the scores were then calculated using the appropriate cut-off point (5 for BGS (see description before) and 4 for UCAPS13) on each score.
To summarize, the way we obtain the two human scores to which we refer as BGS and UCAPS is by (i) aggregation of observers scoring each video, (ii) transforming to pain/no pain (binary score) using appropriate cut-off points.
Pain recognition by machine
Pain detection pipeline: sampling rate: one frame per second; preprocessing: cropping animal faces.
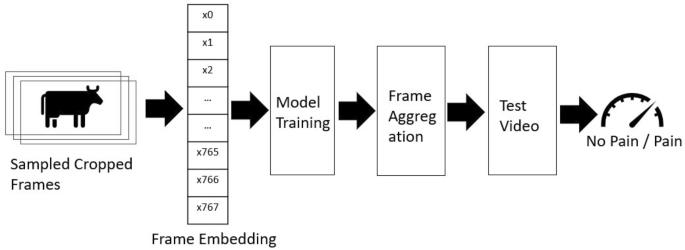
For the pain recognition pipeline, we implemented an approach analogous to the methodology described by Feighelstein et al.20. To enhance practical deployment feasibility in commercial farming environments, we simplified our processing pipeline by removing two computationally intensive components: the Grayscale Short-Term Stacking (GrayST) preprocessing technique and the iterative frame selection retraining phase. The GrayST method, which replaces RGB channels with temporal grayscale frames, was eliminated to reduce preprocessing complexity, while the retraining phase–which selectively fine-tuned models using high-confidence frames–was removed to avoid dependency on iterative model updates and mitigate potential overfitting concerns given our limited dataset size (17 bulls). This streamlined approach prioritizes real-time classification capabilities and computational efficiency, making the system more accessible for veterinary applications where technical expertise and specialized hardware may be limited while maintaining robust performance and reducing the risk of model overspecialization. The computational framework is illustrated in Fig. 2 and delineated comprehensively below.

Illustrative examples of original and cropped frames extracted from the experimental dataset. The original frame (1) undergoes a precise facial region cropping process (2).
-
1.
Frame sampling and cropping. Following the methodology of Feighelstein et al.20, we sampled one frame per second from each video, as the original recordings were captured at 30 frames per second. To isolate the cow’s head within the frames, cropping was applied based on individual detections. Examples of an original frame and the corresponding cropped frame are shown in Fig. 3, panels (1) and (2), respectively. To achieve a precise cropping of the animal’s face, a manual annotation of a bounding box was performed on the first frame of each video. The remaining frames of the video were subsequently cropped using the Segment Anything (SAM) video segmentation33.
-
2.
Frame embedding. For embedding, we employed the DINO ViT-B/16 encoding approach34, which maps images into a 768-dimensional embedding space, representing each image with a unique embedding vector. This is achieved through self-supervised pre-training on large-scale image datasets, leveraging knowledge distillation to learn robust visual representations without explicit labels. Specifically, we encoded images using the ViT-B/16 architecture, a variant of the Vision Transformer (ViT) model designed for high-resolution image feature extraction. The “ViT” designation in ViT-B/16 refers to Vision Transformer, while “B/16” indicates the model’s Base configuration with a 16\(\times\)16 patch size used during training. To ensure comparability across individuals, the extracted embeddings were normalized using Z-score normalization per animal, standardizing the feature distributions within each subject.
-
3.
Model training. In our classification framework, we employ a Stochastic Gradient Descent (SGD) classifier35 with a hinge loss function, corresponding to a linear Support Vector Machine (SVM)36. The model is optimized using an adaptive learning rate, initialized at \(\eta _0 = 1.47 \times 10^{-4}\), and an L1 penalty, promoting sparsity in feature selection. We set a small regularization parameter (\(\alpha = 3.98 \times 10^{-5}\)) to balance generalization and overfitting. The classifier is trained for a maximum of 10,000 iterations with a convergence tolerance of 0.001, ensuring thorough optimization.
-
4.
Video aggregation. Video-level predictions were obtained through majority voting (similarly to37) across all sampled frames within each 3-minute recording, ensuring robust classification that accounts for temporal variability in pain expression.
Performance metrics
We evaluate the ML pipeline performance (and compare it to human) using standard metrics commonly used in the literature: accuracy, precision, recall, F1, sensitivity, and specificity38. We primarily compare F1 scores as our evaluation metric, providing a harmonic mean of precision and recall that appropriately weights both false positives and false negatives in medical applications, which is particularly important for pain assessment where both missing actual pain (false negatives) and incorrectly identifying pain when absent (false positives) have significant clinical implications.
We further use the leave-one-subject-out cross validation with no subject overlap as a validation method39. Due to the relatively low numbers of bulls (n=17) in the dataset, following this stricter method of validation is more appropriate40,41. In our case this means that we repeatedly train on 16 subjects and test on the remaining subject. By separating the subjects used for training, validation and testing respectively, we enforce generalization to unseen subjects and ensure that no specific features of an individual are used for classification.
For each test subject in the leave-one-subject-out cross-validation scheme, predictions were generated at the video level. The performance metrics were calculated per frame or video and subsequently averaged across all frames or all videos in the dataset, providing a robust estimation of classification effectiveness.
Statistical analysis
For a statistical analysis of the performance, we compared areas under the receiver operating characteristic curve (AUCs) with DeLong test42. The AUC represents an index to evaluate the classification performance, that varies from 0 to 100. Accuracy is considered low when values are between 0.50 and 0.70, moderate between 0.70 and 0.90 and high when above 0.9043. Data were analyzed using Jamovi software (https://www.jamovi.org; version 2.3.28.0; Jamovi project (2023)), using Test ROC from the psychoPDA package in R software (version 1.0.5).