Data acquisition, preprocessing, and identification of differentially expressed lactylation-related genes
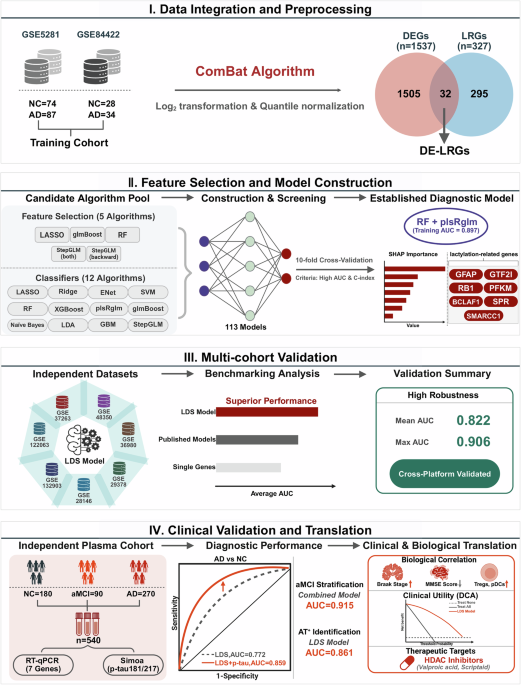
A total of nine publicly available AD-related transcriptomic datasets were included in this study: GSE528138, GSE8442239, GSE12206340, GSE13290341, GSE2814642, GSE4835043, GSE3698044, GSE3726345, and GSE2937846. All datasets were obtained from the Gene Expression Omnibus (GEO) database. Based on the dataset comparison summarized in Table 5, GSE5281 and GSE84422 were selected as the Training Cohort due to their relatively large sample sizes, rigorous diagnostic annotation, and consistent microarray platforms, enabling reliable harmonization and model construction. The remaining seven datasets were used as independent external validation cohorts to assess the robustness and generalizability of the LDS model across different brain regions (e.g., hippocampus, frontal cortex, neocortex), platforms (e.g., GPL570, GPL6947, GPL6244), populations (USA, Japan, Singapore), and diagnostic criteria (clinical diagnosis, Braak stage, MMSE, Consortium to Establish a Registry for Alzheimer’s Disease (CERAD), or autopsy). Detailed information regarding sample sources, profiling platform, demographic characteristics, brain regions, and diagnostic standards for each dataset is provided in Table 5.
To ensure analytical consistency, raw expression matrices and platform annotation files were downloaded using the “GEOquery” package in R47. Gene names were standardized based on probe annotation files. All datasets underwent log2 transformation and quantile normalization to minimize technical variation across different microarray platforms. Quality control was then performed using the “limma” package, and low-expression genes and outlier samples were removed.
To construct a unified Training Cohort, we selected GSE5281 and GSE84422 due to their large sample sizes and comparable tissue types. To address potential batch effects between the two datasets, we applied the ComBat algorithm from the “sva” package48. Principal component analysis (PCA) was used to visualize data distribution before and after batch correction, confirming the consistency of the merged cohort. After these preprocessing steps, we obtained a high-quality and standardized expression matrix for downstream analysis, including differential gene expression, functional annotation, immune landscape evaluation, and machine learning model construction.
Based on the merged Training Cohort, we performed differential expression analysis using the “limma” package. A linear modeling approach followed by empirical Bayes moderation was used to compare global gene expression between the AD and NC groups. Raw P values were adjusted for multiple testing using the Benjamini–Hochberg false discovery rate (FDR) procedure, and both nominal and FDR-adjusted P values are reported in the corresponding Supplementary Data 2. Differentially expressed genes (DEGs) were defined as those with FDR < 0.05 and |log₂ fold change | ≥ 0.585, which corresponds to an absolute fold change of ≥ 1.5 and is commonly used to balance biological relevance and sensitivity in transcriptomic studies. To focus on lactylation-related biology, we obtained a curated list of 327 lactylation-related genes (LRGs) from published literature49. The intersection of DEGs and LRGs yielded 32 differentially expressed lactylation-related genes (DE-LRGs), which served as candidate diagnostic features for downstream analysis.
Consensus clustering and subtype classification
To identify potential molecular subtypes based on lactylation-related signatures, consensus clustering was performed using the “ConsensusClusterPlus” R package. The input matrix was composed of 32 DE-LRGs identified between AD and NC samples. The data were centered and scaled prior to clustering. We applied the partitioning around medoids (PAM) algorithm with Spearman correlation as the distance metric. Clustering was repeated over 500 bootstraps, with 80% of samples resampled in each iteration. The optimal number of clusters (K) was determined by jointly evaluating the consensus matrix heatmaps, cumulative distribution function (CDF) plots, delta area plot, and item-consensus distributions. K = 2 was selected as the optimal solution based on maximal cluster stability, separation, and interpretability. Detailed plots and rationale are provided in Supplementary Fig. 9.
Functional enrichment and immune landscape analysis
To investigate the biological mechanisms underlying lactylation-based subtypes, we performed pathway enrichment analyses using DEGs between the two subtypes (filter criteria: adjusted P < 0.05). Functional annotation was conducted using the “clusterProfiler” package in R. Gene Ontology (GO) and Kyoto Encyclopedia of Genes and Genomes (KEGG) enrichment analyses were carried out, with gene annotation supported by the “org.Hs.eg.db” database. Significantly enriched terms were defined by a q-value < 0.05. Results were visualized using bubble and bar plots, highlighting differences in biological processes (BP), cellular components (CC), molecular functions (MF), and metabolic pathways across subtypes.
To further assess the activation status of hallmark pathways across samples, we applied Gene Set Variation Analysis (GSVA). Two reference gene sets— “c2.cp.kegg.v7.5.1.symbols.gmt” and “h.all.v7.5.1.symbols.gmt”—were used as background to evaluate enrichment score variations between lactylation-high and lactylation-low subtypes and between high-risk and low-risk LDS groups.
For immune microenvironment profiling, we integrated several computational algorithms, including Microenvironment Cell Populations-counter (MCP-counter)50, xCell50, quantification of the Tumor Immune contexture (quanTIseq)50, Immunophenoscore (IPS)51, and Estimation of STromal and Immune cells in MAlignant Tumor tissues using Expression data (ESTIMATE)52 to quantify the abundance of various immune and stromal cell populations. Specific attention was given to T cells, macrophages, dendritic cells, and regulatory T cells (Tregs) to capture key differences in immune cell infiltration across subgroups.
In addition, to explore immune regulation characteristics, we curated literature-based immune-related gene sets, including immune checkpoints, Major Histocompatibility Complex (MHC) molecules, immunostimulatory genes, and chemokines. Their expression profiles were compared across lactylation subtypes using heatmaps and boxplots. Immune functional scores were computed via the single-sample gene set enrichment analysis (ssGSEA) algorithm51, and radar plots were generated to visualize the immune activity landscape of different LDS risk groups.
Construction and multi-cohort validation of the LDS diagnostic model
To construct a lactylation-associated diagnostic model for AD, the DE-LRGs identified in the previous step were used as initial candidate variables. Model development followed a two-stage machine learning framework:
(1) Embedded feature selection: Five feature selection algorithms were applied, including Least Absolute Shrinkage and Selection Operator (LASSO) regression, generalized linear model boosting (glmBoost), random forest (RF), bidirectional stepwise generalized linear modeling (StepGLM [both]), and backward stepwise generalized linear modeling (StepGLM [backward]). These methods were used to identify stable and predictive variables from the DE-LRG set.
(2) Classification modeling: The selected features were then used to train twelve classification algorithms, including LASSO, Ridge regression, Elastic Net (ENet), support vector machine (SVM), RF, extreme gradient boosting (XGBoost), partial least-squares generalized linear modeling (plsRglm), glmBoost, Naïve Bayes, linear discriminant analysis (LDA), generalized boosted regression modeling (GBM), and StepGLM. In total, 113 models were generated—98 models using feature selection followed by classifier training and 15 models using the full DE-LRG set without prior feature filtering.
All models were trained within a unified machine learning framework implemented in R using the RunML platform. The pipeline included standardized preprocessing (z-score normalization of gene-expression features, i.e., centering to zero mean and scaling to unit variance based on the Training Cohort, with the same parameters applied to the external GEO and plasma cohorts), hyperparameter optimization through grid search or internal cross-validation, and performance evaluation using 10-fold cross-validation. Model-specific hyperparameter settings and search ranges are summarized in Supplementary Table 4. Model performance was quantified using area under the receiver operating characteristic curve (AUC), concordance index (C-index), accuracy, sensitivity, and specificity.
Model generalizability was assessed by first evaluating performance in the primary Training Cohort, followed by validation across seven independent external cohorts. To compare discriminative power among high-performing models, pairwise DeLong tests were conducted, with full results provided in Supplementary Data 3.
The final diagnostic framework, termed the LDS, was established using a two-step modeling strategy in which RF was first applied for feature stability screening, followed by model construction using plsRglm. This approach demonstrated the most consistent cross-cohort performance among all candidate pipelines. The resulting LDS consists of seven lactylation-associated genes—GFAP, GTF2I, RB1, PFKM, BCLAF1, SPR, and SMARCC1—selected based on their positive variable importance (VIMP > 0) in the RF feature selection stage, indicating reproducible predictive contribution. To characterize their individual diagnostic relevance, each gene was further evaluated using receiver operating characteristic (ROC) analysis, expression profiling, and correlation assessment.
Finally, to benchmark the LDS against existing transcriptomic diagnostic signatures, eight previously published AD molecular models (Oxidative Stress-based model53, Cuproptosis-related model54, Metabolic model55, Mitochondrial Dysfunction model56, T cell receptor-based model57, 7-methylguanosine [m7G] model58, Immunogenic Cell Death [ICD] model59, and Chromatin Remodeling model60) were re-evaluated across all included cohorts. Pairwise DeLong tests demonstrated consistently superior or comparable diagnostic performance of LDS, with detailed comparisons summarized in Supplementary Data 3.
Model interpretation using Shapley additive explanations (SHAP)
To interpret the contribution of each gene to the LDS model, we applied SHAP. For the final RF + plsRglm classifier, SHAP values were computed for each sample to quantify the marginal contribution of each of the seven LDS genes to the model output (AD vs NC prediction). We summarized feature importance using the mean absolute SHAP value for each gene in the Training Cohort and visualized both the distribution and ranking of SHAP values. In addition, we repeated SHAP-based interpretation in each external GEO cohort and in the independent clinical plasma cohort to assess the stability of gene importance patterns across datasets.
Independent clinical plasma cohort: sample collection, LDS model validation, and aMCI risk stratification
The independent plasma cohort was prospectively enrolled at Zhongda Hospital, Southeast University, between January 2023 and December 2024. The study received approval from the institutional ethics committee (Approval No. 2024ZDSYLL172-PO1) and written informed consent was obtained from all participants in accordance with the Declaration of Helsinki.
A total of 540 participants were included, consisting of 270 patients with AD, 90 individuals with aMCI, and 180 NC participants. AD diagnosis followed the National Institute of Neurological and Communicative Disorders and Stroke–Alzheimer’s Disease and Related Disorders Association (NINCDS-ADRDA) criteria and was confirmed by board-certified neurologists using standardized neuropsychological assessments61. aMCI was defined according to the Petersen criteria, requiring subjective memory decline, objective memory impairment, preserved general cognition, and intact daily functioning62. NC participants exhibited normal cognitive performance with MMSE ≥ 28 and no history of neurological, psychiatric, or major systemic disorders.
Fasting blood samples were collected, processed within 1 h by centrifugation at 4 °C, and stored at −80 °C. Plasma levels of mRNA expression of the seven LDS genes (GFAP, GTF2I, RB1, PFKM, BCLAF1, SPR, and SMARCC1) were quantified by Reverse Transcription Quantitative Real-time PCR (RT-qPCR), and p-tau181 and p-tau217 were measured using Single Molecule Array (Simoa) assays. All analyses were conducted in a blinded manner with respect to clinical diagnosis.
To evaluate the diagnostic generalizability of the LDS, the previously established seven-gene model was applied directly to the independent plasma cohort to discriminate AD from NC participants. Model performance was assessed using ROC analysis, reporting AUC, sensitivity, specificity, and accuracy with 95% confidence interval (CI). In addition to evaluating LDS, p-tau181, and p-tau217 separately, we constructed multivariable logistic regression models that incorporated LDS together with p-tau181 and/or p-tau217 as predictors for AD vs NC. Participants were further stratified into AT⁺ and AT⁻ groups based on predefined biomarker thresholds, and analogous logistic regression models were fitted to assess the ability of LDS and its combinations with p-tau181/217 to identify AT⁺ individuals.
To assess the potential of LDS-associated transcriptional alterations for early-stage detection, a separate aMCI classifier was independently developed, rather than derived from the AD–NC model. This classifier was built using the five LDS genes most consistently upregulated in aMCI (GFAP, GTF2I, BCLAF1, SPR, and SMARCC1). Four machine-learning algorithms—RF, SVM, logistic regression, and LASSO—were trained under 10-fold cross-validation, and feature importance in RF was quantified using the Gini index. For downstream clinical application, we further used logistic regression to build integrated models that combined the RF-derived gene-expression risk score with p-tau181 and/or p-tau217 to evaluate their additive value in detecting aMCI, including AT⁺ cases. Clinical and functional assessments included age, sex, MMSE score, Pittsburgh Sleep Quality Index (PSQI), Nutritional Risk Screening 2002 (NRS2002), Self-Rating Depression Scale (SDS), Self-Rating Anxiety Scale (SAS), Fatigue, Resistance, Ambulation, Illnesses, and Loss of weight (FRAIL) scale, Activities of Daily Living (ADL) score. (Table 6).
Detection of lactylation-related gene expression
Total RNA was extracted from plasma using the TRIzol LS reagent (Invitrogen, Karlsruhe, Germany), and RNA concentration and purity were assessed by NanoDrop spectrophotometry. cDNA synthesis was performed using the HiScript III RT SuperMix kit (Vazyme Biotech, China). RT-qPCR was conducted using Taq Pro Universal SYBR qPCR Master Mix (Vazyme Biotech, China) on the 7500 Fast Real-Time PCR System (Applied Biosystems, USA). The thermal cycling protocol included an initial denaturation at 95 °C for 10 seconds and annealing at 60 °C for 30 s, repeated for 40 cycles, with a total reaction volume of 20 μL. Glyceraldehyde-3-phosphate dehydrogenase (GAPDH) was used as the internal control, and all reactions were performed in technical triplicates. Primer sequences for the key lactylation-related genes are listed in Supplementary Table 5. Relative gene expression levels were calculated using the 2–ΔΔCT method.
Plasma p-tau181 and p-tau217 Quantification
Plasma levels of p-tau181 and p-tau217 were measured using Simoa technology (CJC-Di6000A, China) according to the manufacturer’s instructions. The assay utilizes capture antibodies specific for the phosphorylated tau epitopes immobilized on paramagnetic beads, combined with biotinylated detection antibodies and streptavidin-β-galactosidase enzyme conjugates, enabling ultrasensitive digital quantification of target proteins. Calibration curves were constructed using recombinant p-tau standards, and concentrations were calculated using a four-parameter logistic regression model. Quality control samples were included to monitor assay performance. All analyses were performed blinded to clinical diagnosis.
Identification of candidate therapeutic agents
To explore potential therapeutic compounds targeting the key genes identified in the LDS model, we performed drug enrichment analysis using the Drug Signature Database (DSigDB) module on the Enrichr platform (https://maayanlab.cloud/Enrichr/), which integrates drug–gene interaction data. The seven key lactylation-related genes from the LDS model were input into the Enrichr system, and enrichment analysis was conducted to identify small molecules significantly associated with these targets. Compounds were ranked based on enrichment scores, and those with a P < 0.05 were considered statistically significant. The top-ranked candidate agents were extracted, many of which were associated with epigenetic regulation or energy metabolism, such as histone deacetylase (HDAC) inhibitors and microtubule modulators.
Statistical analysis
All statistical analyses were performed using R software (version 4.3.1). For continuous variables, normality was assessed using the Shapiro–Wilk test. Normally distributed variables were compared using Student’s t-test (two groups) or one-way analysis of variance (ANOVA) (≥3 groups), and non-normally distributed variables were compared using the Wilcoxon rank-sum test or Kruskal–Wallis test. Categorical variables were compared using the chi-square (χ²) test or Fisher’s exact test. Associations between continuous variables (e.g., LDS, p-tau181, p-tau217, clinical and neuropathological scores) were evaluated using Spearman’s rank correlation and reported as correlation coefficients (r) with corresponding P values.
Diagnostic performance of LDS, p-tau181, p-tau217, and their combinations, as well as aMCI classifiers, was evaluated using ROC analysis. AUCs, sensitivity, specificity, and accuracy were reported with 95% CI. Differences between AUCs were assessed using two-sided DeLong tests; when multiple models were compared, P values from DeLong tests were adjusted using the Benjamini–Hochberg FDR method. Calibration curves for the LDS and combined models were generated using bootstrap resampling to compare predicted versus observed event probabilities, and decision curve analysis (DCA) was used to quantify standardized net benefit across a range of threshold probabilities.
For analyses involving multiple comparisons (e.g., differential expression, pathway enrichment, subtype comparisons, and correlation heatmaps), P values were corrected using the Benjamini–Hochberg FDR procedure, and FDR < 0.05 was considered significant. Unless otherwise specified, all other P values are two-sided and unadjusted, with P < 0.05 considered statistically significant.


