Monitoring sites and periods
Data for developing the rule-based filter and machine learning model were collected in Mikawa Bay, Japan, while additional data were obtained from the Seto Inland Sea, Japan, to test the effectiveness of the developed algorithm (Fig. 1). The data were intermittently collected from October 2013 to December 2023 in Mikawa Bay (Table S1). Test data were collected from July 2021 to December 2023 in the Seto Inland Sea, a geographically separated region from Mikawa Bay (Fig. 1, Table S1). This area hosts a distinct finless porpoise population compared to that in Mikawa Bay22,23,24 and exhibits different background noise levels25. Incorporating such variation into the test data enables evaluation of the model’s robustness to minor differences in click train characteristics across sites, populations, and acoustic backgrounds25.
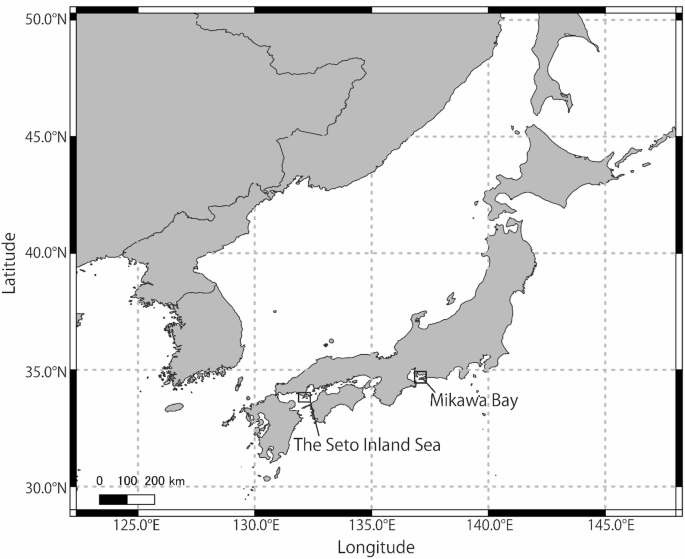
Locations of two data collection areas. The data for training and validation of machine learning model were recorded in Mikawa Bay. The data for testing effectiveness of the developed model were recorded in the Seto Inland Sea. The area enclosed by the rectangle indicates the recorded area. Maps were created in QGIS 3.40.626 with administrative boundaries from GADM27 and coastline data from Natural Earth Data (https://www.naturalearthdata.com/).
All methods were non-invasive and carried out in accordance with relevant guidelines and regulations. The Kyoto University Animal Experiments Committee approved experiments (Inf-K15003, Inf-K16002, Inf-K17004, Inf-K18004, Inf-K19004, Inf-K20010, Inf-K21008, 1–202202, 1–202302). This study is reported in accordance with the ARRIVE guidelines.
Data acquisition instruments
We used A-tags15 (MMT, Saitama, Japan) as pulse event recorders designed to monitor high-frequency underwater acoustic signals. Each A-tag comprises a stereo hydrophone system (hereafter, hydrophones A and B), preamplifier with bandpass filter, CPU, flash memory, and two alkaline batteries. Hydrophone A and B have peak sensitivities at 70 and 130 kHz, respectively28,29 (Figure S1). Two configurations were used: T-type with horizontally arranged hydrophones spaced 590 mm apart, and an I-type with vertically aligned hydrophones spaced 190 mm apart (Figure S1). Since no substantial difference was found in detecting target pulse events between these configurations, the same analysis procedures were applied to all data. The A-tag detects ultrasonic pulse events within the 55–235 kHz band, and records the time of detection of each pulse, the received sound pressure levels (SPL) at the two hydrophones, and the time of arrival difference between the two hydrophones only when the received pressure exceeded a predefined amplitude threshold. Unlike other event recorders, which classify detected signals onboard and store only the processed results16,17,18, the A-tag preserves raw pulse event parameters without onboard classification. Pulse event was stored with a minimum time resolution of 0.5 ms, with the detection threshold set at 139 dB re 1 µPa. The time difference of arrival between the two hydrophones was measured at a resolution of 0.25 µs and stored in association with the time of detection (0.5 ms resolution) and received SPL of both hydrophones. The SPL ratio (SPLR) between hydrophones A and B was used to infer the spectral characteristics of incoming pulse events, such as the relative proportions of high- and low-frequency components, which are useful for distinguishing between Phocoenidae and Delphinidae families28,29. The A-tag was deployed by suspending it from a buoy tethered by a rope, maintaining hydrophone A at a depth of 3 m.
Target pulse events for detection
This study aimed to detect acoustic events of click trains produced by the narrow-ridged finless porpoise. Click trains recorded by the A-tag exhibit smooth changes in SPL and pulse interval 30,31 (Fig. 2a). Unlike many delphinid species, finless porpoise produces only click trains with high frequencies ranging from 100 to 150 kHz. Their click trains were classified into two types: regular clicks, which are used for echolocation, and buzzes. Buzzes, characterized by pulse intervals of ≤ 10 ms, are typically produced during close-range prey approaches32.

Examples of (a) finless porpoise click trains and (b) vessel noise recorded by the A-tag. The x-axis shows the recording time. The y-axes show the received sound pressure level (relative to Pa) at hydrophone A (SPL), the sound pressure level ratio between hydrophones A and B (SPL ratio A/B), the time difference (µs) between hydrophones A and B that can be converted to relative azimuth, and the pulse interval (ms). A positive value for the time difference indicates that the signal arrived at hydrophone A earlier than at hydrophone B.
This study also targeted high-frequency vessel noise that falls within the auditory sensitivity range of the finless porpoise33,34, as assessing noise impacts requires capturing sounds that porpoises can actually perceive. The A-tag detects pulse events only in the 55–235 kHz range, encompassing the auditory sensitivity peak (70-80 kHz) of finless porpoise33,34, and its therefore suitable for assessing high-frequency vessel noise within their ultrasonic acoustic environment. The detected vessel noise is characterized by irregular pulse intervals, SPLs, and time differences of arrival between the two hydrophones, and typically exhibits a prolonged duration35 (Fig. 2b). Such high-frequency noise, typically generated by small, high-speed vessels not equipped with AIS due to cavitation or other mechanisms associated with propellers and engines36,37, is presumed to originate from vessels passing in close proximity to the A-tag, as high-frequency sound attenuates rapidly and does not propagate over long distance.
Overview of the development of a rule-based filter and machine learning model
This section outlines the development of the rule-based filter and machine learning model for detecting and classifying click trains and vessel noise. These two signal types differ markedly in their acoustic characteristics (Fig. 2). Due to these differences, each signal type was processed using a separate rule-based filter and a dedicated machine learning model (Fig. 3).
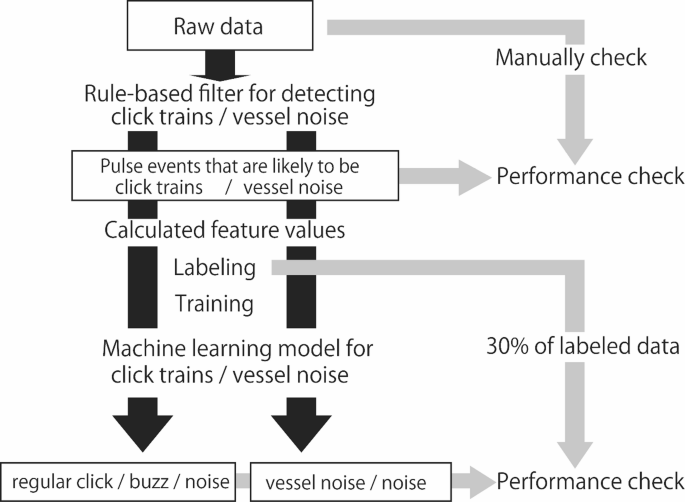
Flowchart of the development and validation processes of the rule-based filter and machine learning model used to classify finless porpoise click trains and vessel noise, based on training dataset.
As a preprocessing step, separate rule-based filter was applied to raw data to eliminate irrelevant noise and extract pulse events likely to be either click trains or vessel noise (Fig. 3). The extracted pulse events were manually reviewed to evaluate detection performance.
For each detected pulse events, feature values were computed for training the corresponding machine learning model. Click-train-like events were labeled as regular clicks, buzzes, or noise, while vessel-noise-like events were labeled as vessel noise or non-vessel noise. Using these labeled events and their feature values, two machine learning models were trained: one to classify click train-related signals (regular clicks, buzzes, and noise) and the other to classify vessel noise events (vessel noise and non-vessel noise). The classification performance of each machine learning model was then evaluated using 30% of the manually labeled dataset, which was held out as validation data.
Development of a rule-based filter
The rule-based filter for detecting click trains and vessel noise was developed using Igor Pro 64 8.04 (WaveMetrics, Portland, OR, USA). This filter was based on the detection criteria described by Kimura et al.20, originally developed to extract Yangtze finless porpoise from stationary A-tag recording. In that study20, the criteria included the following: a passive SPL threshold (≥ 140.4 dB re 1 μPa), a minimum pulse interval (≥ 2.0 ms), a maximum pulse interval (≤ 100 ms), at least six pulses per click train, and coefficient of variation of pulse interval ≤ 0.4. Of these criteria, this study adopted the following criteria for the rule-based filter, excluding the detection threshold, which was predefined by the A-tag’s recording setting: minimum pulse interval (≥ 2.0 ms), a maximum pulse interval (≤ 100 ms), a minimum of six pulses per click train, and coefficient of variation of pulse interval ≤ 0.4 (Table 1). Because click trains produced by Phocoenidae, including finless porpoises, typically exhibit an SPLR greated than 0.628,29, a threshold of 0.6 was adopted for the rule-based filter (Table 1). Additional criteria were initially defined based on empirical knowledge. These criteria were subsequently refined by comparing filter outputs with manual annotations of the raw data, to improve click train detection. These criteria (Table 1) included the following: a minimum duration of click train (≥ 12 ms), a maximum standard deviation of arrival-time differences between hydrophones A and B (< 25 µs), a maximum coefficient of variation (standard deviation/mean) of received SPL at hydrophone A (≤ 100), and maximum median pulse interval within a click train (< 100 ms). Pulse events satisfying all nine criteria were selected as candidate finless porpoise click trains.
On the other hand, the rule-based filter for detecting vessel noise was developed using pulse intervals, number of consecutive pulses, and minimum continuous duration (Table 2), based on the typical acoustic characteristics of vessel noise. These criteria were optimized by comparing filter outputs with manual annotations of the raw data, resulting in final settings of pulse intervals shorter than 500 ms within pulse events, more than 80 consecutive pulses within a pulse event, and a minimum continuous duration of a pulse event of ≥ 10 s (Table 2).
The detection accuracy of the established rule-based filter was calculated using manually validated datasets. The raw time-series data recorded by A-tags were plotted using Igor Pro, manually annotated, and subsequently analyzed using the rule-based filter to evaluate the number of target pulse events (click trains or vessel noise) successfully detected within the validation dataset (Fig. 3). Detection rates were defined as the proportion of click trains or vessel noise events correctly identified by the rule-based filter relative to the total number manually confirmed in the raw data. Additionally, the total number of candidate events detected by the rule-based filter was also quantified. The accuracy of the rule-based filter for detecting click trains was evaluated based on a verified dataset totaling 36 h (Table S1). For vessel noise detections, a separate dataset was used due to the relatively low occurrence of such events, totaling 408 h (Table S1).
Preparation of training and validation datasets for a machine learning model
Click trains and vessel noise events detected by the rule-based filter were characterized by 18 and 17 feature values, respectively. In addition to common acoustic parameters such as the number of pulses, duration, pulse intervals, and SPLs, temporal features represented by “Start” and “End” timestamps were also included (Table 3). These feature values were selected not only to capture seasonal and diel patterns, but also to incorporate empirical observations, such as that a pulse event is more likely to originate from finless porpoises if porpoise clicks have been detected immediately beforehand. Click trains were classified into regular clicks and buzzes following definitions established in previous studies, where a buzz was specifically defined as a sequence containing five or more consecutive pulses with intervals ≤ 10 ms38,39. To facilitate this distinction, a binary feature value called “BuzzCheck” was implemented to return 1 when the click train satisfied the definition of buzzes and 0 otherwise. The same set of feature values used for click trains was applied to vessel noise, excluding “BuzzCheck,” which was irrelevant for vessel noise.
A subset of the training data was labeled for developing and evaluating machine learning models. After applying the rule-based filter, pulse events detected as click trains were manually classified and labeled into three groups: regular clicks, buzzes, and noise. In contrast, pulse events detected as vessel noise were manually classified and labeled into two groups: vessel noise and non-vessel noise. The labeling of click trains was based on a dataset totaling 72 hours, while labeling of vessel noise events was based on a dataset totaling 720 hours (Table S1).
Development of a machine learning model
The machine learning model was developed using the random forest algorithm implemented in the scikit-learn toolbox in Python 3.9.740,41. The random forest is a machine learning algorithm based on ensemble learning, in which multiple decision trees are combined to improve prediction accuracy42. Random forests are commonly used for classification tasks due to their robustness and high accuracy, particularly in classifying small cetacean vocalizations43,44. Training and validation were conducted using 70% and 30% of the labeled pulse event data, respectively (Fig. 3). Hyperparameters were optimized for each model, with a maximum tree depth of 30, a minimum sample split of 7, and a total of 100 estimators.
Performance evaluation
The performance of the machine learning model was evaluated based on five metrics: accuracy (Eq. 1), precision (Eq. 2), recall (Eq. 3), F1-score (Eq. 4), and false positive rate (FPR) (Eq. 5). These metrics were calculated based on four values: true positive (TP), true negative (TN), false positive (FP), and false negative (FN). TP represents instances correctly predicted as positive, TN denotes instances correctly predicted as negative, FP refers to instances incorrectly predicted as positive, and FN refers to instances incorrectly predicted as negative. In this evaluation, regular clicks and buzzes were combined into a single category of click trains, based on definitions operationalized using the “BuzzCheck” feature. The binary feature enabled deterministic separation between regular clicks and buzzes, with no ambiguity or overlap. The performance of the machine learning model was evaluated separately for detecting click trains and vessel noise.
Accuracy indicates the overall ability of the model to correctly identify both target and non-target events. Accuracy was calculated using Eq. (1):
$$\begin{array}{*{20}c} {\frac{{{\text{TP}} + {\text{TN}}}}{{{\text{TP}} + {\text{TN}} + {\text{FP}} + {\text{FN}}}}} \\ \end{array}$$
(1)
Precision indicates the proportion of instances predicted as target events that were correctly classified. Precision was calculated using Eq. (2):
$$\begin{array}{c}\frac{\text{TP}}{\text{TP}+\text{FP}}\end{array}$$
(2)
Recall indicates the proportion of actual target events that were correctly identified by the model. Recall was calculated using Eq. (3):
$$\begin{array}{*{20}c} {\frac{{{\text{TP}}}}{{{\text{TP}} + {\text{FN}}}}} \\ \end{array}$$
(3)
F1-score indicates the harmonic mean of precision and recall and serves as a comprehensive metric for evaluating the balance between these two measures. F1-score was calculated using Eq. (4):
$$\begin{array}{c}\frac{2*\text{Recall}*\text{Precision}}{\text{Recall}+\text{Precision}}\end{array}$$
(4)
The FPR indicates the proportion of non-target events that were incorrectly classified as target events. The FPR was calculated using Eq. (5):
$$\begin{array}{c}\frac{\text{FP}}{\text{TN}+\text{FP}}\end{array}$$
(5)
Finally, to evaluate the time savings achieved by applying the developed rule-based filter and machine learning model, approximately 395 h of A-tag data were analyzed, and the total time required for manual detection was compared with that required when using the combined rule-based filter and machine learning approach.
Validation of the developed algorithm on test data
To evaluate the generalizability of the rule-based filter and machine learning model developed using A-tag data recorded in Mikawa Bay, we evaluated them using a test dataset recorded in the Seto Inland Sea, separately assessing performance for click trains and vessel noise (Fig. 1). The performance of the rule-based filter was evaluated by comparing the number of click train and vessel noise events detected manually with those detected by the filter in the test datasets. Detection accuracy was calculated as the percentage of filter-based detections relative to manual detections. In addition, the total number of pulse events identified by the filter as candidate click trains or vessel noise was also counted. For the machine learning model, classification was performed on pulse events detected by the rule-based filter. The classification results were then compared with manual verification results to determine the number of TP, FP, TN, and FN instances. Based on these values, standard performance metrics—including accuracy, recall, precision, F1-score, and FPR—were calculated according to their respective equations. A total of 16 h of data were used for click train analysis, and 456 h for vessel noise analysis.