

Study population and data collection
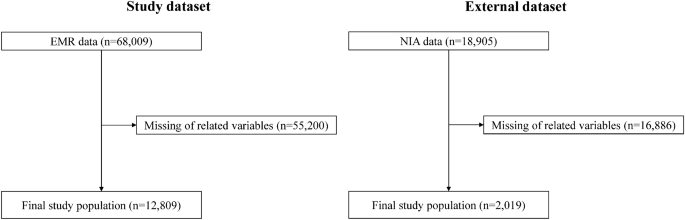
The data used in this retrospective study were obtained from two independent longitudinal cohorts previously enrolled in an observational study. The hospital-based data consisted of electronic medical records from outpatients, inpatients, and emergency departments collected between January 1, 2008 and December 31, 2022. Eligible participants were selected among patients with type 2 diabetes, excluding those with type 1 diabetes and a history of CVD. Finally, 12,809 patients were selected from the tertiary hospital of Kyung Hee University Medical Center for the discovery cohort. Data for additional validation were collected from retrospective datasets from the secondary hospitals of Kyung Hee University Medical Center, Gachon University Gil Hospital in Gangdong (validation cohort), and 2019 eligible patients were selected (Figure 1).
Input variables
The model included a comprehensive set of 68 variables. Patient baseline demographic characteristics included age and sex. Medical history included the presence of hypertension, dyslipidemia, macrovascular complications (cerebrovascular disease, dementia, Parkinson's disease, and lower limb amputation), microvascular complications (diabetic retinopathy, proliferative diabetic retinopathy, diabetic neuropathy, and chronic kidney disease), and cancer. Medication history included types of antidiabetic medications (metformin, sulfonylureas, dipeptidyl peptidase 4 inhibitors, meglitinides, thiazolidinediones, α-glucosidase inhibitors, insulin, glucagon-like peptide 1 receptor agonists, and sodium-glucose cotransporter 2 inhibitors), and antihypertensive medications (angiotensin II receptor blockers, angiotensin-converting enzyme inhibitors, and calcium channel blockers). [CCB]diuretics, beta-blockers), lipid-lowering drugs (statins, fibrates, ezetimibe, omega-3, other lipid-lowering drugs), and antiplatelet drugs (aspirin, clopidogrel, cilostazol, glycoprotein IIb/IIIa antagonists, other antiplatelet drugs) were measured. Clinical parameters included mean and range of body mass index (BMI).19Blood test means and ranges included glycated hemoglobin (HbA1c), serum glucose, total cholesterol, triglycerides, high-density lipoprotein cholesterol, low-density lipoprotein (LDL) cholesterol, serum creatinine, aspartate aminotransferase (AST), alanine aminotransferase (ALT), gamma-glutamyltransferase, and alkaline phosphatase (ALP) levels.
Identifying new CVD cases
New-onset CVD in patients with type 2 diabetes was identified using International Classification of Diseases, 10th Revision (ICD-10) codes for ischemic heart disease and myocardial infarction (I20.X-I25.X), heart failure (I50.X), and atrial fibrillation (I48.X).The primary outcome was new CVD diagnosis within 3 years.
Data Preprocessing
Missing data were excluded from the analysis. Covariates were divided into three sections: (1) demographic data, (2) physical examination and blood test, and (3) medication and comorbidity information. Physical examination and blood test data before CVD incident were utilized using the examination date. The entire data set was calculated and converted to an average. The range was calculated by subtracting the maximum and minimum values recorded during this period. Initial consultation information on medication and comorbidities was selected as a covariate.
Model training and validation
A common ML approach for prediction is to split the data into a training and test set. In this study, the given data target for 3-year CVD incidence was insufficient. Therefore, the model was trained on the entire dataset rather than split for internal validation. Instead, a separate external dataset was used to evaluate the extent to which the model can generalize. This approach is essential to validate whether the model performs well on data it has never seen before.
Model Development
We selected decision tree-based ensemble models such as XGBoost (XGB), Random Forest (RF), LightGBM (LGM), and AdaBoost (ADB), as well as linear classification models such as Logistic Regression (LR) and Support Vector Machine (SVM). Among these, XGB, RF, and LGM models are the most common and practical models for handling a mixture of categorical and continuous variables. For SVM models, we selected the linear kernel for its simplicity and efficiency, especially for high-dimensional data where the number of features is much larger than the number of samples. The linear kernel is useful when the data is linearly or nearly linearly separable.
To optimize the performance of each model, we performed hyperparameter tuning using GridSearchCV to maximize the area under the receiver operating characteristic curve (AUROC) to determine the optimal combination of hyperparameters.
ML Analytics
To determine the AUROC score, various tree-based and linear classification models were used to predict the potential occurrence of CVD. The AUROC score was used as the scoring metric to optimize the hyperparameters of this model using GridSearchCV. Once the optimal hyperparameters were determined, the model was trained for subsequent predictions. Given the class imbalance in the data, a synthetic minority oversampling technique was used to generate synthetic samples.
To evaluate the model performance, we used various metrics, including AUROC, accuracy, sensitivity, specificity, and balanced accuracy. These metrics were calculated based on the probability predictions generated by the model. We then calculated the mean and 95% confidence interval (CI) for each performance metric to measure both the mean and variability of the model performance. Due to characteristics such as the small size of the external dataset, we used a bootstrap method rather than traditional cross-validation. By resampling the dataset multiple times and performing bootstrap with up to 10,000 iterations, we were able to assess the sample distribution and calculate the 95% CI for the model performance metrics. To visually represent the model performance, we plotted a receiver operating characteristic (ROC) curve. This was complemented by the mean ROC curve, which reveals the distribution of model performance, and the standard deviation within it.
To identify the most important features for predicting CVD, we took advantage of the inherent feature importance mechanisms provided by tree-based models such as RF, XGB, and LGM. These mechanisms primarily evaluate feature importance based on metrics such as the Gini impurity reduction and average impurity reduction methods that calculate gains. The top 15 features that had the greatest impact on the model were selected and plotted in a bar chart to show their impact on model predictions.
Performance Indicators
To get a comprehensive understanding of the model performance, we selected five performance metrics: AUROC, accuracy, sensitivity, specificity, and balanced accuracy. AUROC is a robust performance metric for the model's ability to distinguish classes across all possible thresholds. Its robustness comes from the fact that it considers both sensitivity and specificity, making it the recommended metric, especially in class-imbalanced situations. Accuracy is a simple and intuitive performance metric that provides the proportion of true results (both true positives and true negatives) from the total number of cases examined. However, accuracy alone can be misleading, especially for imbalanced datasets, and therefore additional performance metrics are required. Sensitivity and specificity were chosen to assess how accurately the model identified positive and negative cases, respectively. Sensitivity measures the proportion of true positives correctly identified by the model, providing insight into the model's ability to detect positive cases. Specificity, on the other hand, measures the proportion of actual negatives correctly identified, providing a sense of the model's ability to avoid false alarms. Finally, we added balanced accuracy to provide a more balanced assessment of the model's performance, especially in the face of class imbalance. As the average of sensitivity and specificity, balanced accuracy assigns equal weight to both metrics and is therefore a good alternative to accuracy when dealing with imbalanced datasets. Combining these metrics allows us to evaluate the model performance from different perspectives, ensuring a more robust evaluation.20,21.
Software and Libraries
All data preprocessing, model development, and analysis were performed using Python 3.9.16. Key libraries used in the study included Scikit-learn 1.2.2, NumPy 1.23.5, and Pandas 1.5.3 for ML algorithms and data manipulation. Matplotlib 3.7.1 and Seaborn 0.12.2 were used for data visualization.
Ethical approval
This study was approved by the Kyung Hee University Hospital Institutional Review Board (No. KHSIRB-22–473(EA)). Because de-identified data were used in the analysis, the Institutional Review Board waived the requirement for informed consent. All studies were conducted in accordance with relevant guidelines, regulations, and the Declaration of Helsinki. This study followed the guidelines outlined in the Transparent Reporting of Multivariate Predictive Models for Individual Prognosis or Diagnosis (TRIPOD) statement.twenty two.


