
research design
This was a descriptive, observational, cross-sectional study in chronic neck pain patients and an asymptomatic control group based on a previously published descriptive study protocol.33.
The study followed STROBE guidelines34.
Study procedures included (1) participant enrollment and informed consent, (2) assessment of eligibility criteria, (3) invitation to participate if deemed eligible, (4) recording of demographic variables, (5) pain-related descriptive variables, and (6) primary outcome (functional task kinematics).
ethical approval
Ethical approval was obtained from the CEU San Pablo University Research Ethics Committee (495/21/39) in accordance with the Declaration of Helsinki and WHO guidelines.
Informed consent was collected from all subjects and/or their legal guardians prior to study participation. Participants can withdraw at any time.
Informed consent was obtained from the study participants to publish their information/images in an open access online publication.
samples and selections
Patients with neck pain and asymptomatic subjects were recruited as a non-probability convenience sample via flyers, online forms, social networks, email, and direct verbal communication at CEU San Pablo University, CEU San Pablo University Clinic, and private physical therapy clinics.
Participants aged 18 to 65 years with neck pain were eligible to enroll in the study if they met the following inclusion criteria: (a) nonspecific mechanical neck pain ≥3 on the Visual Analogue Scale (VAS), (b) ≥5 on the Neck Disability Index (NDI), and (c) lasting ≥3 months. Exclusion criteria include: (a) history of craniocervical surgery; (b) uncorrected visual impairment or bony deformity in the thoracic, cervical, or cranial region; (d) Dizziness/vertigo. (e) Complex local syndrome. Eligible participants assigned to the asymptomatic group must be pain-free for at least 1 year and have not received any previous treatment for neck pain.
pain assessment
Age, gender, weight, height, and upper extremity dominant side were recorded before motion analysis testing. Next, descriptive pain variables (VAS, NDI, pain duration) were measured. (a) Pain intensity over the past week (VAS). (b) Neck disorders (Spanish version of the Neck Disability Index -NDI)35); (c) Duration of pain (months). Subjects with a score of 0 on each of the three variables were considered asymptomatic.
Instrumentation and operational analysis
Kinematics is small (4 cm x 4 cm x 8 cm) and lightweight (< 200 g) の慣性測定ユニット (IMU) ワイヤレス センサー (Werium Solutions©、マドリード、スペイン) を使用して記録され、頸部可動域 (ROM) の測定に信頼性が実証されています (クラス内相関係数)[ICC]= 0.93) および頭頸部屈曲 (ICC > 0.80)24,27. Based on previous research showing the highest reliability of IMU technology for measuring cervical range of motion27,36sensors were placed on the participant’s forehead and T4 spinous process.
As approached in similar studies15,16 A blinded rater assessed kinematic variables during testing, and another researcher recorded demographic and questionnaire data.
Kinematics of functional tasks
Participants performed two functional tasks in random order: (a) a high-intensity weight-shifting task and (b) drinking water. For both tasks, participants sat in a fixed chair with a backrest, their feet flat on the floor, and their hands resting on their thighs. In front of them was a height-adjustable table used to hold water glasses and weights.
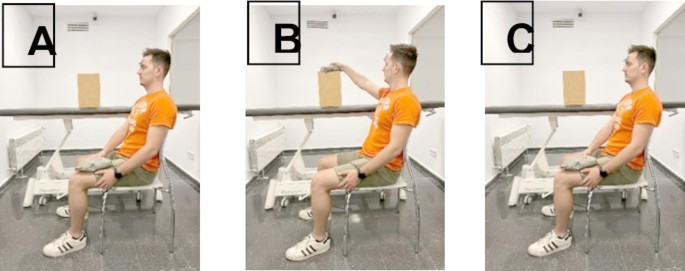
Heavy weight movement task based on the protocol of Tsang et al.twenty one In this experiment, a 2 kg weight was transferred from the non-dominant thigh to a high platform (70 cm above the thigh, 30 cm in front of the knee, and 30 cm lateral to the acromion), and the process was repeated three times (Figure 1). As described by Tsang et al.twenty onethis task simulates common daily activities and matches items from the Functional Neck Disability Questionnaire.
In the water-drinking task, participants picked up a glass of water from a table (on their knees, 30 cm in front of them), took a sip, and returned the glass, repeating the process three times until participants took three sips of water and finished drinking with the last sip. (Figure 2). This procedure has not been previously described and was designed for this study. By using the patient’s knees as a reference for positioning the table height, the table position could be adapted to the participant’s dimensions. Patients drank water from graduated plastic glasses containing the same amount of water for all participants. This task mimics everyday movements that require stretching the neck, especially when the water level drops.

(a) Weightlifting. (B) Place a weight on top of the box. (C) Lift weights. (a) starting position. (B) weight is transferred to the box. (C) The weight has been returned to its initial position.

(a) starting position. (B) Lift your glass. (C) Drinking water. (D) Return to end position.
The protocol began with the participant sitting comfortably in a high-backed chair, feet flat on the floor, neck and head in a neutral position, and hands relaxed on the thighs. Standardized instructions were displayed on the screen and the steps were explained. (Supplementary Material Appendix 1). Before beginning, the examiner ensured that participants understood the protocol and addressed any questions they had. Sensors were then placed on the forehead and T4 spinous process to prompt participants to memorize the neutral position of their head. After sensor calibration, participants first repeated a randomly selected functional task three times. This was followed by three repetitions of other functional tasks.
Kinematic data processing
Kinematic data processing is described in Appendix 2 of the Supplementary Materials.
Feature extraction and statistical analysis
Feature extraction
Relevant features are extracted from the motion signal and used as predictors instead of using the entire signal, thus reducing the dimensionality of the data. Feature extraction was based on established motion analysis parameters and common time series characteristics from previous studies. To characterize the relevant aspects of the motion, a total of 15 features were computed, including motion range (one feature), peak velocity (one feature), smoothness (log dimensionless jerk: one feature), spatiotemporal interplane coordination (three features), energy distribution by frequency (seven features), and motion heterogeneity (two features), all of which are described next. The simplest features included are range of motion (ROM) and maximum velocity. Log dimensionless jerk (LDLJ) was used to characterize the smoothness of the main plane.37. Here, the main plane refers to the plane where most of the movement is expected to occur. For example, high-load weight transfer tasks are dominated by rotation, whereas water drinking tasks are dominated by flexion.
Three PCA-based metrics were used to analyze the coordination between spatiotemporal planes.38. PCA was applied to the three measured variables (flexion, extension, rotation, etc.) using the variance explained by the first two principal components as features. Contributions to the principal directions of the principal planes are also included.
Fourier transform analysis characterized the energy distribution across the frequency band, scaled within (-0.5, 0.5]. Seven spectral features were derived from the predefined frequency band: (0, 0.1], (0.1, 0.15], (0.15, 0.2], (0.2, 0.25], (0.25, 0.3) , (0.3, 0.4]and (0.4, 0.5]. Note that the energy in the (0, 0.1]band is closely related to the dispersion of the signal.
Movement heterogeneity was assessed using metrics that quantify the variation in movement patterns over time. High heterogeneity values indicate large changes in variability, while low values indicate a consistent pattern. After prewhitening the time series to remove mean, trend, and autoregressive (AR) information, we fitted a GARCH (1,1) model to the prewhitened series as follows.\(\:{\text{x}}_{\text{t}}\)). Two features were extracted: the sum of squares of the first 12 autocorrelation series. \(\:{\text{x}}_{\text{t}}^{2}\)and the sum of squares of the first 12 autocorrelations of the residual series \(\:{\text{z}}_{\text{t}}^{2}\).
For the elevated weight transfer task, features were averaged over three repetitions. For the water-drinking task, only the last repetition was analyzed, as it was hypothesized that it would yield the most discriminatory information, as it required participants to extend their necks further to finish their nearly empty glass.
statistical analysis
A machine learning model was used to assess the discriminability of behavioral features between chronic neck pain and asymptomatic groups.
permutation test was used39 To assess whether the observed discrimination between groups represents a genuine pattern or a chance event. The tests repeatedly shuffled the group labels and compared the model’s performance on the original data and the randomized data. The resulting p-value indicates how often the random permutation matches or exceeds the performance of the original model. The small p-value suggests that the model’s discriminatory ability relies on the true relationship between movement features and participant condition, indicating that these features contain meaningful information to distinguish individuals with pain from asymptomatic controls.
The analysis used a logistic regression model with elastic net regularization.40 Used for classification between chronic neck pain and asymptomatic groups. This approach was chosen because of its use of high-dimensional data and correlated predictors, and the effectiveness of combining L1 and L2 penalties to balance feature selection and model stability. Features were standardized and features with correlation coefficients greater than 0.9 were removed. The energy in the frequency band is PCA transformed to preserve 90% of the variance. Recursive feature removal with 5-fold cross-validation was used for initial feature selection, followed by hyperparameter tuning with grid search using 10-fold cross-validation on the reduced feature set. This two-step approach allows efficient computational processing.
Model performance was evaluated using the area under the receiver operating characteristic curve (AUC-ROC).41computed through nested 10-fold cross-validation. The nested cross-validation structure ensures proper separation of training and testing data at each stage of model development (feature selection, hyperparameter tuning, and evaluation), prevents data leakage, and provides an unbiased estimate of model performance.
For permutation tests, this entire process was repeated 10 times for each experimental condition using randomized group labels, and the mean and standard deviation of p-values were calculated to assess confidence in statistical significance. This report format was chosen to reflect both central tendency and variability across permutation test iterations, providing insight into the stability of results. Range values (minimum and maximum) are also reported to provide additional information about the distribution of p-values.
For significant models, the absolute value of the model coefficient was used to assess the importance of the feature. Results were compared with traditional univariate statistical tests, applying a false discovery rate (FDR) correction for multiple comparisons.
Sample size calculation
The sample size for this study was determined using G*Power version 3.1.9.2.42considers the results of a pilot study with 20 participants: 10 patients with neck pain and 10 asymptomatic participants. Sample size was calculated for the above variables during each task. The variable with the largest sample size estimate was peak velocity of rotation during the high-load locomotion task. Because the data were normally distributed, sample size was calculated using a two-group one-tailed t-test with a confidence level of 0.95 and a power of 0.8. Considering an effect size of 0.68 and velocity score (°/s) ± standard deviation (111.80 ± 30.22 for the asymptomatic group and 90.27 ± 32.77 for the chronic neck pain group), we estimated a sample size of 48 participants per group.


