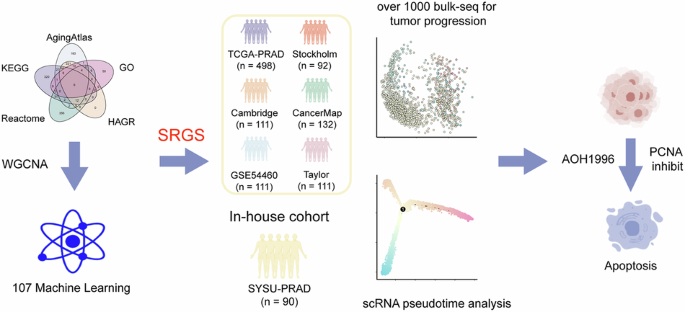
Identification of senescence-related genes associated with PCa prognosis
Figure 1 presents this study’s overall design. First, we collected aging-related genes from five publicly available databases (Fig. 2a, Supplementary Data 1). Gene modules linked with clinical features were then identified via co-expression network analysis, with a β value of 7 (R2 = 0.84) considered to be optimum for network construction (Fig. S1A). Overall, 29 distinct modules were identified, each represented by a unique color (Fig. 2b, Fig. S1B) and the eigengene (representing the first principal component of expression in specific modules). Correlations between the gene modules and clinical traits, such as T stage, Gleason score, age, and BCR, were subsequently calculated. Among all module-trait relationships, the red module showed the strongest correlation with clinical traits (Fig. 1c). Additionally, genes were selected as hub prognosis-related genes if they exhibited a module membership (MM) > 0.5 as well as a gene significance (GS) > 0.2 (Fig. 2d–f). Finally, we intersected the 316 genes identified from the WGCNA red module with senescence-related genes from the public databases, resulting in 38 overlapping genes that were considered key candidates for further analysis (Fig. 2g, Supplementary Data 2).

The outline of the figure was obtained from the free website BioGDP.com (https://biogdp.com/).

a Senescence-related genes were collected from five databases. b Module genes were constructed using bulk RNA-sequencing data from TCGA-PRAD. c Correlation analysis was performed between module genes and clinical phenotypes. d Scatter plot illustrating correlations between Gene Significance (GS) and Module Membership (MM) under the T stage phenotype in the red module genes. Red points represent genes highly associated with the T stage. Statistical test: Pearson’s correlation analysis and two-sided unpaired t-test. e Scatter plot showing the correlation between GS and MM under the Gleason Score phenotype in the red module genes. Red points represent genes highly associated with the Gleason Score. Statistical test: Pearson’s correlation analysis and two-sided unpaired t-test. f Scatter plot showing the correlation between GS and MM under the Biochemical Recurrence (BCR) phenotype in the red module genes. Red points represent genes highly associated with BCR. Statistical tests: Pearson’s correlations and two-tailed unpaired t-tests. g The overlapping RNAs between WGCNA results and all senescence-related genes.
Construction of the prostate cancer senescence-related gene signature (SRGS)
Based on the 38 genes identified in the previous analysis, a consensus SRGS was constructed using machine-learning integration. Using the TCGA-PRAD cohort, 117 predictive models were trained using the LOOCV framework before calculating the C-index for the individual models in the validation cohorts (Fig. 3a) with the optimal model combining LASSO regression and SuperPC (Fig. 3a, Supplementary Data 3). The optimal λ\lambda value for LASSO regression was determined when the partial likelihood deviance was minimal under the LOOCV framework (Fig. 3b), resulting in a nine-gene signature (Fig. 3c).

a A total of 117 prediction models were evaluated using the LOOCV framework. The C-index of each model was calculated across all validation cohorts and combined cohorts. b The optimal λ was calculated from the lowest partial likelihood deviance value in the TCGA-PRAD cohort. c Composition and corresponding coefficients of genes included in the SRGS model. d Kaplan–Meier curves for Biochemical Recurrence (BCR) according to the SRGS in the TCGA-PRAD cohort (n = 498). e Kaplan–Meier curves for BCR according to the SRGS in the Stockholm cohort (n = 92). f Kaplan–Meier curves for BCR according to the SRGS in the Cambridge cohort (n = 111). g Kaplan–Meier curves for BCR according to the SRGS in the CancerMap cohort (n = 132). h Kaplan–Meier curves for BCR according to the SRGS in the GSE54460 cohort (n = 100). i Kaplan–Meier curves for BCR according to the SRGS in the Taylor cohort (n = 140).
After calculating risk score for each patient, we employed the survminer package to determine the cohort-specific optimal cut-off value using BCR as the risk event. This threshold was subsequently used to stratify patients into high- and low-risk groups. Overall, high-risk cases showed markedly worse BCR outcomes relative to those with low-risk in the TCGA-PRAD training dataset and the six independent validation cohorts (all P < 0.05) (Fig. 3d–i).
Evaluation of the SRGS model and comparison with other gene expression-based prognostic signatures
The predictive performance of SRGS was further assessed according to area under the curve (AUC) values for six cohorts: TCGA-PRAD (0.709), Stockholm (0.693), Cambridge (0.68), CancerMap (0.714), GSE54460 (0.6551), and Taylor (0.747) (Fig. S2A). Time-dependent ROC analysis showed AUCs for SRGS at 1, 3, and 5 years of 0.791, 0.738, and 0.664 in TCGA-PRAD; 0.787, 0.756, and 0.7 in Stockholm; 0.83, 0.716, and 0.705 in Cambridge; 0.624, 0.692, and 0.745 in CancerMap; 0.735, 0.66, and 0.634 in GSE54460; and 0.818, 0.773, and 0.783 in Taylor (Fig. S2B).
Additionally, the prognostic significance of SRGS was compared with clinical information across all six cohorts. Notably, SRGS achieved the highest C-index in all cohorts, demonstrating its superior predictive accuracy and stability (Fig. S2C).
In recent years, advances in big-data technologies and next-generation sequencing enabled the application of machine learning for developing various prognostic and predictive gene expression signatures. To benchmark SRGS against existing signatures, we systematically retrieved 60 published signatures (Supplementary Data 4), representing different biological processes, including androgen biosynthesis and catabolism, autophagy, ferroptosis, cuproptosis, immune response, and DNA damage repair. Univariate Cox regression analysis of these signatures across all datasets revealed that SRGS demonstrated significant associations with prognosis (Fig. S3A), underscoring its robustness.
Furthermore, SRGS outperformed the other signatures in terms of C-index across all datasets (Fig. S3B). Unlike many other models, SRGS, reduced to nine genes through LASSO regression and SuperPC, exhibited better extrapolation potential and reduced the risk of overfitting, achieving consistently strong predictive performance across multiple cohorts.
Validation using an in-house clinical cohort
The clinical applicability of the SRGS model was further validated by evaluating its performance in the SYSU-PRAD cohort, comprising RNA sequencing data of 90 PCa patients (Supplementary Data 5). Kaplan–Meier survival analysis indicated significantly worse BCR outcomes for patients with high SRGS scores in comparison with those having low SRGS scores (P < 0.0001; Fig. 4a). Time-dependent ROC analysis demonstrated the predictive effectivness. of SRGS, with AUC values of 0.6969, 0.7559, and 0.7869 for predicting BCR at 1, 2, and 3 years, respectively (Fig. 4b).

a Kaplan–Meier survival curves for Biochemical Recurrence (BCR) according to SRGS in SYSU-PRAD cohort (n = 90). b Time-dependent ROC analyses for assessing BCR at 1, 2, and 3 years in the SYSU-PRAD cohort. c Comparison of SRGS with other clinical factors for prognostic prediction in SYSU-PRAD cohort (n = 90). Data represent mean ± 95% CI. d Heatmap showing the correlation between SRGS and 50 tumor-associated pathways in SYSU-PRAD cohort. e Correlation analysis between SRGS and somatic copy number alterations (SCNA) in SYSU-PRAD cohort. Statistical test: Pearson correlation analysis. f Correlation analysis between SRGS and tumor mutational burden (TMB) in SYSU-PRAD cohort. Statistical test: Pearson correlation analysis.
SRGS was found to be independently predictive of BCR in PCa based on univariate and multivariate Cox analyses (Fig. S4A, B). Furthermore, when comparing the predictive performance of SRGS with other clinical features, SRGS consistently exhibited superior performance (Fig. 4c).
To investigate the biological pathways linked to SRGS, ssGSEA was undertaken to calculate the enrichment scores of 50 hallmark pathway. It revealed a positive correlation between SRGS and pathways related to apoptosis and DNA damage (Fig. 4d), consistent with findings in the TCGA cohort (Fig. S5A). These results align with previous studies suggesting that markers of cellular senescence may promote DNA damage while simultaneously inhibiting apoptosis [5].
As expected, SRGS was positively correlated with both tumor mutational burden (TMB) and somatic copy number alteration (SCNA) in our cohort (P < 0.05, Fig. 4e, f). Within the TCGA-PRAD cohort, significantly higher mutation rates in TP53 and an overall higher TMB were noted for patients in the high SRGS group (Fig. S5B, C). Collectively, these findings suggest that tumors with higher SRGS scores are likely to harbor more extensive genetic alterations, potentially driving further tumor progression.
SRGS promotes prostate cancer disease progression
Given the potential of SRGS to promote PCa progression, we analyzed RNA-seq profiles from over 1000 human prostate samples to characterize its dynamic role across different disease stages. Patients were first stratified based on their progression from normal epithelial tissue to primary tumor, and subsequent CRPC, and neuroendocrine (NE) PCa, using a previously published tool [25] (Fig. 5a). Notably, we observed that SRGS was significantly upregulated throughout PCa progression (Fig. 5b, c), and positively correlated with bulk tumor pseudotime analysis (P < 0.0001, Fig. 5d). Importantly, we found that the SRGS also effectively predicted overall survival in patients with CRPC (Fig. 5e). These results highlight the potential utility and clinical relevance of SRGS in advanced PC and CRPC.

a PCA of pan-prostate cancer transcriptomes from normal prostate (green), primary prostate cancer (blue), castration-resistant prostate cancer (CRPC, purple), and neuroendocrine prostate cancer (NEPC, dark red). b PCA visualizing SRGS activation during prostate cancer disease progression. c Boxplots showing SRGS scores across different prostate cancer progression stages. Statistical test: two-sided unpaired Wilcoxon test. d Correlation analysis between SRGS scores and pseudotime. Statistical test: Pearson correlation analysis. e Kaplan–Meier survival curves for overall survival (OS) according to SRGS in SU2C cohort (n = 80). f UMAP visualization of the tumor microenvironments in primary prostate cancer and CRPC; different colors represent different cell types. g UMAP visualization of epithelium subsets in primary prostate cancer and CRPC; different colors represent different clusters. h Violin plots showing SRGS scores across different epithelial cell clusters. i Dot plot showing SRGS gene set levels in different epithelial cell clusters.
Since bulk RNA-seq data does not provide detailed information on the tumor cell expression profiles, single-cell RNA sequencing was conducted on data from five in-house primary PCa patients and five CRPC patients from public databases [26]. After annotation, we identified nine distinct cell subpopulations. NK cells and T cells were combined into the NK_T cell group, resulting in a total of eight subpopulations: Epithelium, Endothelial, Fibroblast, NK_T, B, Plasma, Myeloid, and Mast cells. Tumor epithelial cells represented the largest proportion of the single-cell population (Fig. S6A–C). Although epithelial cells remained the predominant cell type across different disease stages, we observed significant heterogeneity within tumor epithelial cells (Fig. 5f, g, Fig. S6D), which is consistent with prior study [27].
We next evaluated the expression of SRGS in epithelial cell subpopulations and found that clusters 2 and 4 exhibited higher SRGS expression (Fig. 5h). Notably, clusters 2 and 4 were more prevalent in CRPC. Additionally, we observed that epithelial cluster 4 was significantly enriched in metabolism-related pathways, while epithelial cluster 2 showed increased expression of ribosomal pathways (Fig. S7A). The results align with previous ones suggesting that subpopulations with high expression of aging-related genes, despite being in a relatively quiescent G1 phase, are still metabolically active [28]. This metabolic state may serve as a protective mechanism, promoting further tumor progression.
Further analysis with inferCNV revealed that clusters 2 and 4 had significantly higher copy number variations (CNVs) compared to other clusters (Fig. S7B, C). This finding supports the idea that tumor cells with high SRGS expression may harbor greater genetic instability, potentially driving tumor progression (Fig. 4e, f). Interestingly, when the expression of individual genes within the SRGS was examined, we found that PCNA was highly expressed in clusters 2 and 4 (Fig. 5i), indicating that PCNA could be involved in promoting PCa progression.
PCNA as a potential therapeutic target for high-risk PCa
PCNA’s role in promoting PCa was investigated by analyzing PCNA expression in TCGA and GTX datasets. It was found that PCNA levels were significantly higher in PCa tissues in comparison with normal ones (Fig. 6a). We further validated this finding in the SYSU-PRAD cohort, comprising 90 PCa patients, using protein expression data. In patients with a gleason score >7, PCNA protein expression was notably elevated (Fig. 6b). Moreover, high PCNA expression correlated with poorer BCR outcomes (Fig. 6c).

a Boxplots comparing PCNA expression between cancerous and normal prostate prostate tissues in the TCGA and GTX datasets. Statistical test: two-sided unpaired Wilcoxon test. b Boxplots showing PCNA protein levels in Gleason-score >7 vs Gleason-score ≤7 groups in the SYSU-PRAD protein cohort (n = 90). Statistical method: two-sided unpaired Wilcoxon test. c Kaplan–Meier survival curves of biochemical recurrence (BCR) stratified by PCNA protein expression in the SYSU-PRAD protein cohort (n = 90). d Visualization of PCNA activation across prostate cancer disease progression stages. e Scatter plot analyzing the correlation between PCNA expression and prostate cancer disease progression using Pearson correlation analysis. f Boxplots illustrating PCNA expression across different prostate cancer stages. Statistical method: two-sided unpaired Wilcoxon test. g–i Pseudotime analysis of cell trajectories utilizing Monocle 2 to assess epithelial cellular dynamics during prostate cancer progression: g Visualization in state. h Visualization in different group. i Visualization of pseudotime progression with changes in PCNA expression.
Interestingly, we also observed significant upregulation of PCNA during PCa progression, with its expression being positively correlated with pseudotime analysis of bulk tumor progression (P < 0.0001, Fig. 6d–f). Additionally, single-cell monocle analysis revealed two distinct ways in tumor epithelial cells, one of which progressed toward CRPC. During this progression, PCNA expression gradually increased, whereas the other SRGS genes showed relatively low contribution (Fig. 6g–i, Fig. S8A–C). These findings further support PCNA’s role in promoting PCa progression and present it as a promising target for therapy.
PCNA as a therapeutic target for high-risk PCa
We inhibited PCNA with PCNA inhibitor AOH1996 in PC3 and DU145 cells to further validate its role in PCa. We confirmed the expression of PCNA in PC3 and DU145 cells using Western blotting and qPCR (Fig. S9A, B). In addition, consistent results were observed in the CTPC dataset and in our previously published study [29, 30] (Fig. S9C, D). Given the previously suggested involvement of PCNA in regulating cell proliferation and apoptosis, we performed CCK-8 and colony formation assays. It was found that treatment with AOH1996 markedly reduced the proliferation of PC3 and DU145 cells (Fig. 7a, b). Additionally, apoptosis assays revealed that PCNA inhibition significantly increased the proportion of apoptotic PC3 and DU145 cells, while treatment with Z-VAD-FMK, a pan-caspase inhibitor, effectively reduced the proportion of apoptotic cells. (Fig. 7c).

a CCK-8 assay demonstrating the effect of AOH1996 on the proliferation of PC3 and DU145 cells. Statistical method: two-sided unpaired t test. b Colony formation assays showing the influence of AOH1996 on the clonogenicity of PC3 and DU145 cells. Statistical method: two-sided unpaired t test. c Flow cytometry apoptosis analysis revealing the effect of AOH1996 on the proportions of apoptotic PC3 and DU145 cells. Statistical method: one way ANOVA followed by Dunnett’s test.
The role of PCNA in vivo was also validated by inducing subcutaneous tumors in nude mice (Fig. 8a). Consistent with the in vitro findings, tumors treated with PCNA inhibitor exhibited markedly slower growth relative to the controls. On day 5, tumors were harvested, with analysis revealing a marked decrease in both tumor volume and weight for the PCNA-inhibited groups in comparison with the control (Fig. 8b–d).

a Experimental scheme for PC3 subcutaneous xenografts in nude mice. b Representative images of tumors and volume for 6 days in subcutaneous xenograft mice. The scale bar presents 5 mm. c, d Statistical analysis of tumor volume and tumor weight in different groups of nude mice. e Experimental scheme for RM1 orthotopic xenografts in C57BL/6 mice. f Statistical analysis of tumor weight in different groups of RM1 orthotopic xenografts. Data are shown as mean and SD. Statistical method: one-way ANOVA with Dunnett’s test. g Representative images of Ki67 immunohistochemical staining, Caspase3 immunohistochemical staining, and TUNEL staining. The scale bar presents 100 μm. Data are shown as mean and SD. Statistical method: one-way ANOVA with Dunnett’s test.
To better mimic the PCa microenvironment, we established orthotopic tumor models in 4-week-old C57BL/6 mice (Fig. 8e). After treatment with AOH1996, tumor weight measurements demonstrated that orthotopic tumor growth was significantly attenuated. Notably, the combination of AOH1996 with enzalutamide further enhanced this effect (Fig. 8f). IHC staining revealed increased caspase-3 expression but reduced Ki67 expression in tumors following treatment with the PCNA inhibitor alone or in combination with enzalutamide. TUNEL assay results further demonstrated that treatment with the PCNA inhibitor alone or in combination with enzalutamide, significantly increased the proportion of apoptotic tumor cells (Fig. 8g).
Altogether, the findings confirmed that PCNA inhibitors can lower resistance to ADT while enhancing enzalutamide’s efficacy in treating PCa.
Ethics approval
All animal experiments complied with the ethics of animal experiments in the Experimental Animal Center of Sun Yat-sen University ([2025] no. 011).


