
Image by author
# introduction
Last month, I found myself staring at my bank statement, trying to figure out where my money was actually going. Spreadsheets felt like a hassle. Existing apps are like black boxes, and the worst part is that they require you to upload sensitive financial data to a cloud server. I wanted something different. I needed an AI data analyst to analyze my spending, identify unusual transactions, and give me clear insights while keeping my data 100% local. So I made it.
What started as a weekend project turned into a deep dive into real-world data preprocessing, hands-on machine learning, and local power. large language model (LLM). This article explains how to create an AI-powered financial analysis app. python With “vibe coding”. Along the way, you’ll learn many practical concepts that you can apply to any data science project, whether you’re analyzing sales logs, sensor data, or customer feedback.
By the end, you will understand:
- How to build a robust data preprocessing pipeline to handle messy real-world CSV files
- How to select and implement machine learning models when training data is limited
- How to design interactive visualizations that actually answer your users’ questions
- How to integrate local LLM to generate natural language insights without sacrificing privacy
Complete source code is available at: GitHub. Feel free to fork it, extend it, or use it as a starting point for your own AI data analyst.
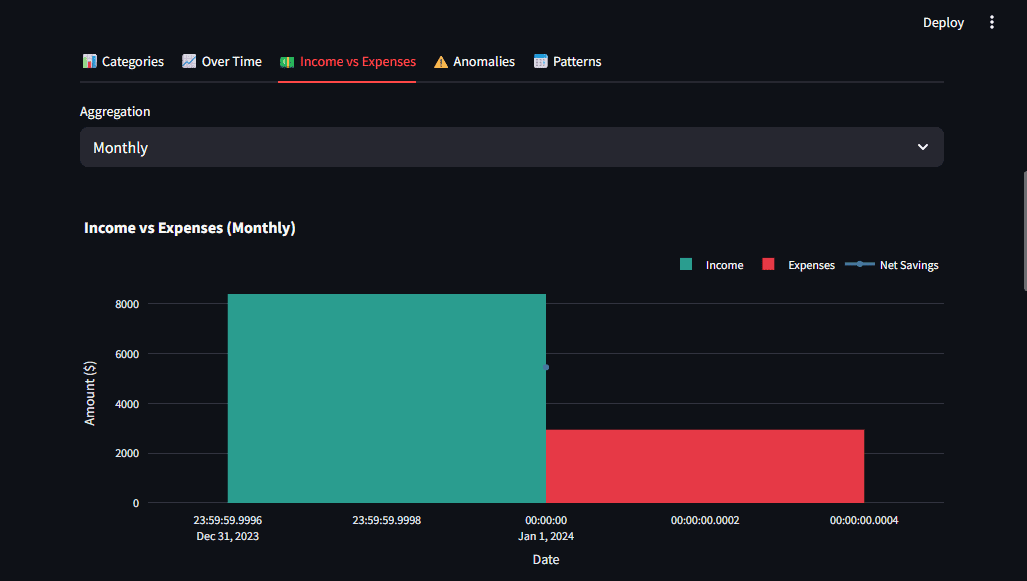
Figure 1: App dashboard showing spend breakdown and AI insights | Image by author
# Question: Why did we create this?
Most personal finance apps have a fundamental flaw. That means the data is out of your control. When you upload your bank statements to the Service, your information may be stored, processed, and monetized. I wanted a tool like this:
- Upload your data and analyze it instantly
- Everything done locally – no cloud, no data leaks
- Deliver AI-powered insights, not just static graphs
This project served as a vehicle for me to learn several concepts that every data scientist should know, such as handling inconsistent data formats, choosing algorithms that work on small datasets, and building privacy-preserving AI capabilities.
# Project architecture
Before getting into the code, here is the project structure showing how the parts fit together.
project/
  ├── app.py              # Main Streamlit app
  ├── config.py           # Settings (categories, Ollama config)
  ├── preprocessing.py    # Auto-detect CSV formats, normalize data
  ├── ml_models.py        # Transaction classifier + Isolation Forest anomaly detector
  ├── visualizations.py   # Plotly charts (pie, bar, timeline, heatmap)
  ├── llm_integration.py  # Ollama streaming integration
  ├── requirements.txt    # Dependencies
  ├── README.md           # Documentation with "deep dive" lessons
  └── sample_data/
    ├── sample_bank_statement.csv
    └── sample_bank_format_2.csv
We’ll walk through the construction of each layer step by step.
# Step 1: Build a robust data preprocessing pipeline
The first lesson I learned was that real-world data is messy. Different banks export CSV in completely different formats. Chase Bank uses “transaction date” and “amount.” Bank of America uses “Date,” “Payee,” and separate “Debit” https://www.kdnuggets.com/ “Credit” columns. Moniepoint and OPay each have their own style.
The preprocessing pipeline should automatically handle these differences.
// Automatic detection of column mappings
We built a pattern matching system that identifies columns regardless of naming conventions. Regular expressions allow you to map ambiguous column names to standard fields.
import re

COLUMN_PATTERNS = {
    "date": [r"date", r"trans.*date", r"posting.*date"],
    "description": [r"description", r"memo", r"payee", r"merchant"],
    "amount": [r"^amount$", r"transaction.*amount"],
    "debit": [r"debit", r"withdrawal", r"expense"],
    "credit": [r"credit", r"deposit", r"income"],
}

def detect_column_mapping(df):
    mapping = {}
    for field, patterns in COLUMN_PATTERNS.items():
        for col in df.columns:
            for pattern in patterns:
                if re.search(pattern, col.lower()):
                    mapping[field] = col
                    break
    return mapping
Key insight: Design for differences, not specific formats. This approach works for any CSV that uses common payment terms.
// Normalization to standard schema
Once the column is detected, normalize Organize everything into a consistent structure. For example, a bank that splits debits and credits should combine them into a single amount column (negative for expenses, positive for income).
if "debit" in mapping and "credit" in mapping:
    debit = df[mapping["debit"]].apply(parse_amount).abs() * -1
    credit = df[mapping["credit"]].apply(parse_amount).abs()
    normalized["amount"] = credit + debit
Important points: Please normalize your data as soon as possible. This simplifies all subsequent operations, including feature engineering, machine learning modeling, and visualization.
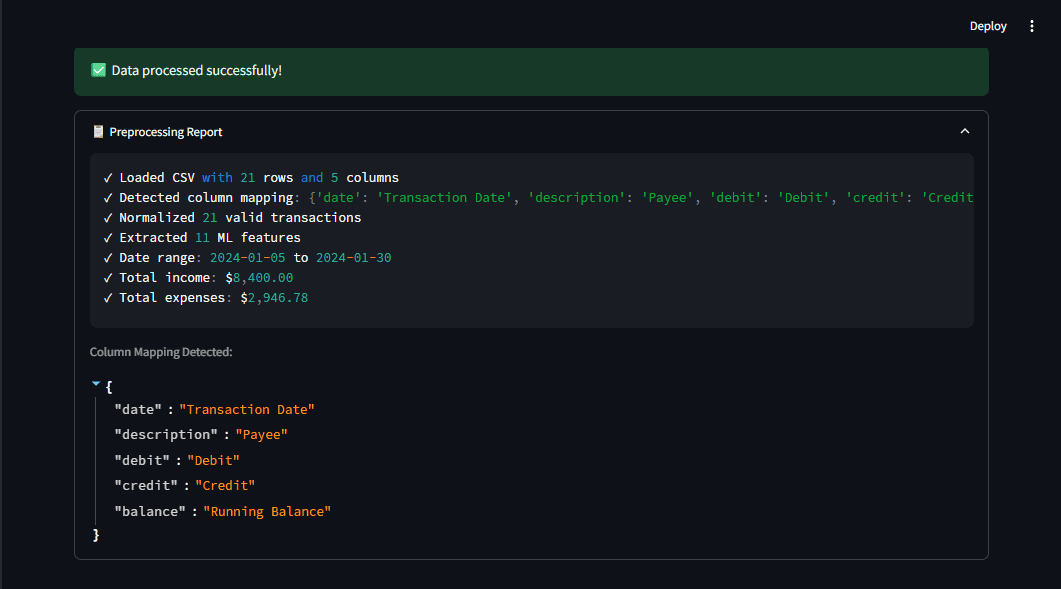
Figure 2: The preprocessing report shows what the pipeline detects, giving you transparency. Image by author
# Step 2: Select a machine learning model for limited data
The second major challenge is the limited training data. Users upload their own statements, but there are no large labeled datasets to train deep learning models. We need an algorithm that works well with small samples and can be enhanced with simple rules.
// Transaction classification: a hybrid approach
Instead of pure machine learning, we built a hybrid system.
- Rule-based matching for certain cases (e.g. “WALMART” → keywords like groceries)
- Pattern-based fallback for ambiguous transactions
SPENDING_CATEGORIES = {
    "groceries": ["walmart", "costco", "whole foods", "kroger"],
    "dining": ["restaurant", "starbucks", "mcdonald", "doordash"],
    "transportation": ["uber", "lyft", "shell", "chevron", "gas"],
    # ... more categories
}

def classify_transaction(description, amount):
    for category, keywords in SPENDING_CATEGORIES.items():
        if any(kw in description.lower() for kw in keywords):
            return category
    return "income" if amount > 0 else "other"
This approach works immediately without training data and is easy for users to understand and customize.
// Anomaly Detection: Why Isolation Forest?
To detect abnormal spending, we needed an algorithm like this:
- Works with small datasets (different from) deep learning)
- Make no assumptions about the distribution of your data (unlike statistical methods like Z-score alone).
- Provide fast predictions for interactive UIs
From the forest of isolation scikit-learn I checked all the boxes. Isolate anomalies by randomly partitioning the data. Anomalies are fewer in number and different, which reduces the number of splits required for separation.
from sklearn.ensemble import IsolationForest

detector = IsolationForest(
    contamination=0.05,  # Expect ~5% anomalies
    random_state=42
)
detector.fit(features)
predictions = detector.predict(features)  # -1 = anomaly
We also combined this with a simple Z-score check to detect obvious outliers. a Z score The location of the raw scores is expressed as the distance from the mean measured by the standard deviation.
\[
z = \frac{x – \mu}{\sigma}
\]
The combined approach detects more anomalies than either method alone.
Important points: A simple, well-chosen algorithm may outperform a complex one, especially when data is limited.
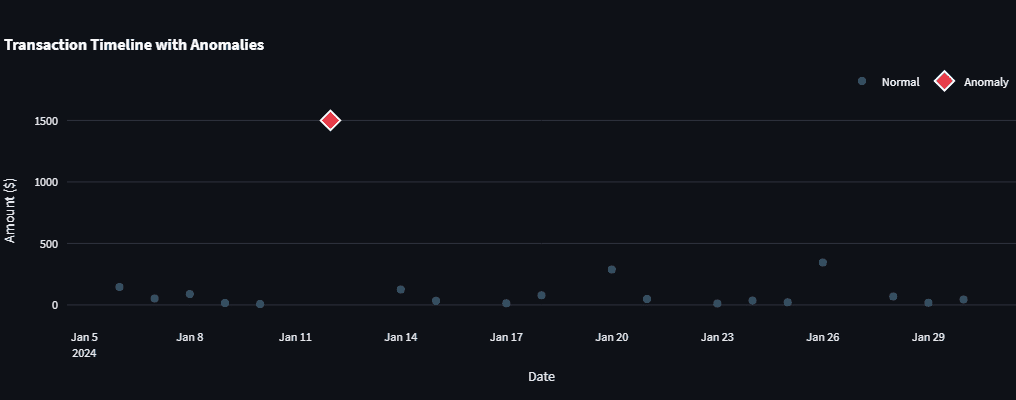
Figure 3: Anomaly detector flags anomalous transactions that stand out in the timeline. Image by author
# Step 3: Design a visualization that answers your question
Visualizations need to answer questions, not just display data. i used plannedly It’s perfect for interactive graphs because it allows users to explore the data themselves. The design principles I followed are:
- Consistent color coding: red for expenses, green for income
- Context through comparison: View income and expenses side by side
- Gradual disclosure: First display an overview and then allow users to drill down.
For example, the expense breakdown uses a donut chart with a hole in the middle for a cleaner look.
import plotly.express as px

fig = px.pie(
    category_totals,
    values="Amount",
    names="Category",
    hole=0.4,
    color_discrete_map=CATEGORY_COLORS
)
stream light You can easily add these charts st.plotly_chart() Build responsive dashboards.
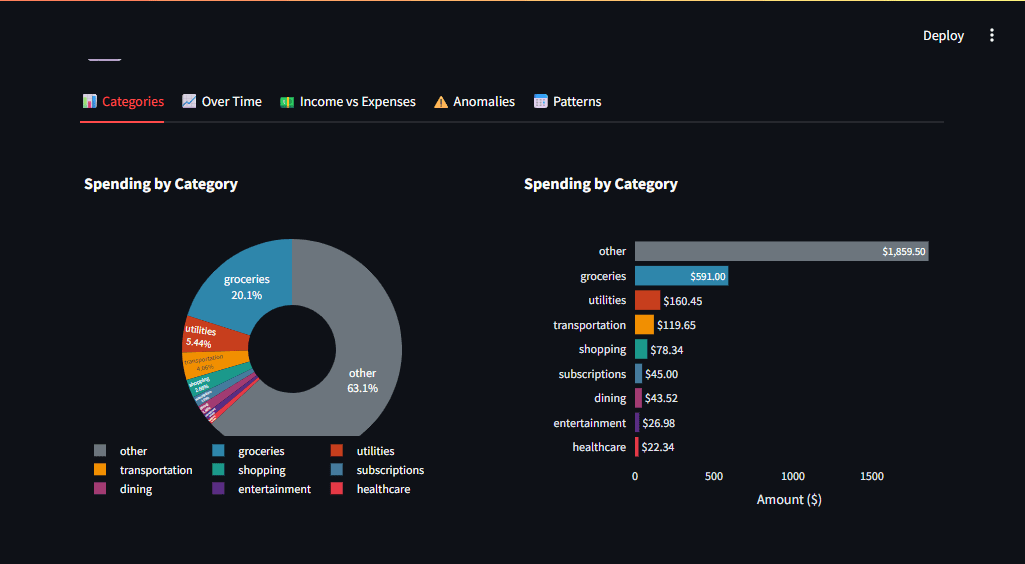
Figure 4: Multiple chart types allow users to get different perspectives on the same data. Image by author
# Step 4: Integrating local large-scale language models for natural language insights
The final part was to generate human-readable insights. I decided to integrate oramaa tool for running LLM locally. Why local instead of phone? OpenAI or Claude?
- Privacy: Bank data never leaves your machine
- Cost: Unlimited queries, no API fees
- Speed: No network delays (but takes a few seconds to generate)
// Improving user experience with streaming
It may take several seconds for LLM to generate a response. Streamlit displays tokens as they arrive, which makes the wait seem shorter. This is a simple implementation using requests With streaming:
import requests
import json

def generate(self, prompt):
    response = requests.post(
        f"{self.base_url}/api/generate",
        json={"model": "llama3.2", "prompt": prompt, "stream": True},
        stream=True
    )
    for line in response.iter_lines():
        if line:
            data = json.loads(line)
            yield data.get("response", "")
In Streamlit, you can display this like this: st.write_stream().
st.write_stream(llm.get_overall_insights(df))// Rapid engineering of financial data
The key to useful LLM output is structured prompts that contain real data. for example:
prompt = f"""Analyze this financial summary:
- Total Income: ${income:,.2f}
- Total Expenses: ${expenses:,.2f}
- Top Category: {top_category}
- Largest Anomaly: {anomaly_desc}

Provide 2-3 actionable recommendations based on this data."""
This gives the model concrete numbers and provides more relevant insights.
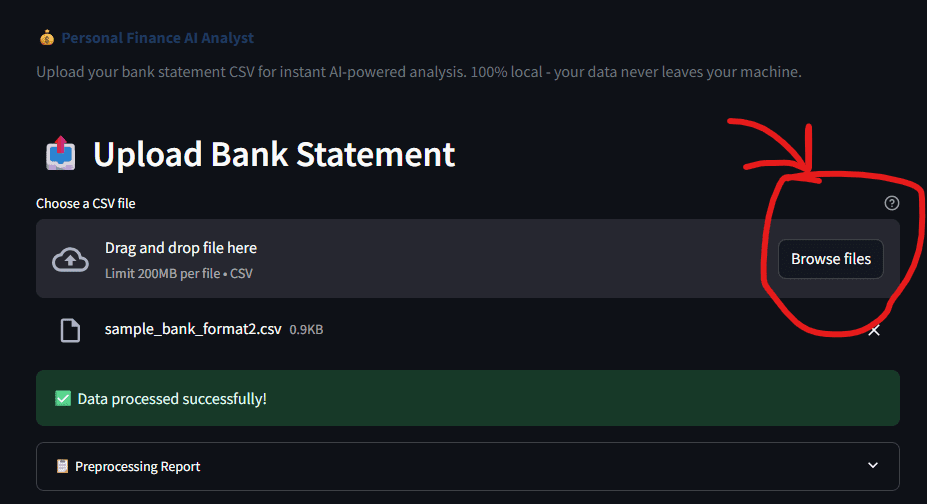
Figure 5: The upload interface is simple. Choose CSV and let AI do the rest | Image by author
// Running the application
It’s easy to get started. You need to install Python before you can run it.
pip install -r requirements.txt

# Optional, for AI insights
ollama pull llama3.2

streamlit run app.py
Upload your bank CSV (the app auto-detects the format) and within seconds you’ll see a dashboard with categorized transactions, anomalies, and AI-generated insights.
# conclusion
This project taught me that building something functional is just the beginning. The real learning happened when I asked why each part worked.
- The reason for auto-detecting columns is because real world data does not follow a schema. Building flexible pipelines saves time on manual cleanup.
- why isolated forest?Because small datasets require algorithms designed for them. Deep learning is not always necessary.
- Why Local LLM? Because privacy and cost are important in production. Now you can run your models locally, which is both practical and powerful.
These lessons apply far beyond personal finance, whether you’re analyzing sales data, server logs, or scientific measurements. The same principles of robust preprocessing, pragmatic modeling, and privacy-aware AI benefit any data project.
Complete source code is available on GitHub. Fork it, extend it, and make it your own. If you make something cool with it, I’d love to hear about it.
// References
Shittu Olumido A software engineer and technical writer with a passion for leveraging cutting-edge technology to craft compelling stories, he has a keen eye for detail and a knack for simplifying complex concepts. Shittu can also be found at Twitter.

