Photo collection
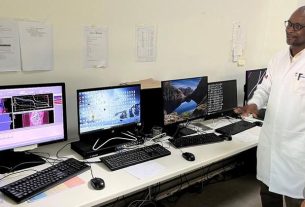
To complete our model training task, we do the data collection at the archaeological site to guarantee the accuracy and consistency of the information. We decided to use a light-proof shed and LED lights to establish a steady photographic environment during the data collection procedure due to the potential impact that various lighting settings may have on the experimental results. We also made sure the camera was in a stable position to ensure the photos were clear and stable, and we ensured that pottery pieces of different sizes could be fully displayed in the photos. We sought the advice of specialists during the data annotation procedure to guarantee the precision and dependability of each pottery piece’s designation.
In order to collect the most comprehensive dataset possible, we conducted a random sampling of pottery excavated from various carbon sites. There are a total of 1864 photographs of the photographed pottery, which are divided between 968 photographs of sand-tempered pottery and 896 photographs of charcoal-tempered pottery.
Data preprocessing
For fear of the loss of experimental accuracy caused by changes in the experimental environment and shooting background, we first pre-processed the captured photos.
Firstly, we utilize a background removal tool integrated in Python to replace the background of all image data with white. This process minimizes any potential interference with experimental data. Secondly, we crop the data to different scales to ensure that the pottery occupies the main body of the data as much as possible, based on its size. We only flipped and transformed the angle of the pottery pieces and did not involve changes in brightness and color because there are tiny holes on the pottery pieces, which may be an important basis for classification, and the brightness and color transformation would destroy this feature. Through the above steps, we successfully collected and self-constructed a dataset containing the pottery shards of the Hemudu culture. This dataset can provide rich and reliable information for the study of Hemudu culture pottery and also provide references for scholars in other related fields.
Spurious features in data
The information contained in pottery data can be broadly categorized into two types: texture information and shape information. Pottery sherds possess intricate shape and section details due to varying fragmentation conditions. Archaeologists believe that the shape of pottery sherds is non-replicable and non-repetitive29, and shape information alone is not enough to be used as a basis for the classification of pottery sherds. However, when we conducted experiments to analyze the shape information of pottery sherd images, the results contradicted our initial assumptions. Figure 4 shows the classification results of different processing of the data. First, we extracted the shape information of the pottery sample and performed binarization on it. Directly classifying the binarized image yielded an accuracy rate of ~70%. In the next step, we extract the texture information by cropping the pottery shards to eliminate their edge and shape information, focusing solely on classifying the surface texture information. The results showed poor accuracy (~89%), suggesting that some crucial information was missing. To tackle this issue, we considered the shape information in the pottery shard data a spurious feature and devised a method to effectively eliminate this spurious feature while avoiding the loss of essential information. This approach aimed to strike a balance between excluding shape information and retaining other important details.

The blue curve represents the classification results when considering the overall image information, achieving an accuracy of 95%. The green curve represents the classification results when only the central region, containing texture information, is cropped and analyzed, resulting in an accuracy of 89%. Lastly, the red curve represents the classification results when using a binarized image, focusing solely on shape information, resulting in an accuracy of 74%.
Pottery classification
Pottery’s classification is a significant and complex operation that addresses grouping similar objects from an archaeological excavation or a surface collection based on some attributes30; In a previous paper29, the authors demonstrated that the traditional method for shape and dimensional characterization is not reproducible and repeatable. In the early days, some studies tried to use the texture and color features of pottery to classify pottery fragments. Such methods usually use the Gabor filter to extract features, then use KNN (K-Nearest Neighbors) or SVM (Support Vector Machine) to complete the classification31,32,33,34. This classification method relies on manual design with low accuracy and low generalization ability35. tries to use deep convolutional networks to complete the classification of pottery. However, in ref. 35, there is no targeted design for the particularity of the ceramic image, resulting in poor results.
Experiments
In this section, we run tests to see if our suggested tailored approach can beat out other classification models for the best results. In addition, we explore the influence of different data augmentation strategies and hyperparameters in the model on classification accuracy to obtain accurate results.
Comparison with other methods
Image classification is a well-established and well-developed task. In the context of pottery classification, we compared our work against several classification models, and the results are presented in the Table 1. Our targeted processing method yielded the highest accuracy on the pottery dataset.
The results obtained on larger models like ViT36, which have more parameters and focus on global information, confirm that the shape and other global information in the pottery dataset are detrimental to our task objectives. Rather, models that employ convolution, such as ResNet, with a relatively small receptive field and a focus on local information are better suited for our dataset. In addition, when compared to general supervised contrastive learning methods, our targeted data augmentation technique is crucial as it significantly enhances the model’s ability to handle samples that are very similar in features. Figure 5 displays the CAMs visualization results for different models. In Fig. 5a, which illustrates the output of resnet-5037, the edges are bright, indicating an increased level of attention, while the central region does not receive much weight. Conversely, in Fig. 5b, our method’s result shows a relatively higher emphasis on the central region, and the model is no longer prioritizing information related to the pottery’s edges or shape, which is in alignment with our task objective.

CAM visualization results under different methods. CAMs provide interpretable evidence that our method suppresses edge/shape-biased responses and reallocates attention toward central, texture-related cues that are truly discriminative for pottery classes. This shift explains the improved robustness on samples with similar global shapes. a CAM of ResNet, which tends to emphasize edge/shape-related regions. b CAM of ours, which reduces edge/shape bias and highlights more central, texture-related discriminative regions.
Data augmentation
In contrast learning, data augmentation is a common technique used to increase the diversity and richness of training data, thus improving the generalization ability and performance of the model38. The accuracy of classification will be greatly increased by incorporating a competent data augmentation algorithm into the training phase39,40. Data augmentation generates new training samples by performing various transformations and expansion operations on the original data to increase the robustness of the model in the face of different situations. Obviously, data augmentation is extremely important in contrast learning, so whether all augmentations are effective in improving the generalization of the model for our pottery dataset is what we need to explore in our experiments.
To ensure effective and precise elimination of spurious information associated with edges and shapes, we devised a data augmentation that involved determining a suitable cropping scheme for the image as our benchmark. Subsequently, we conducted an array of tests on varied cropping schemes, as shown in the Table 2. By examining the outcomes of our tests, we discovered that opting for a cropping scheme with a smaller cropping ratio did not lead to optimal feature representation. Our projections were consistent with this finding, as smaller cropped image data can lack critical feature information essential for thoroughly representing the entirety of the pottery sherds characteristics. Therefore, we recommend selecting a cropping ratio that is not too small to ensure a comprehensive analysis of the available features of the pottery sherd image. So we chose RandomResizedCrop (0.4, 0, 8) as the basic operation of our data augmentation.
Next, various image transformation methods were examined to understand their impact on the model. The transformations included color changes, brightness adjustments, Gaussian blur, and others commonly used in self-supervised contrastive learning. The Fig. 6 shows an illustration of different data augmentations. The findings, as presented in Table 2, revealed that transformations affecting texture information, such as color changes, had a negative impact on accuracy for ceramic tile data. On the other hand, transformations that disrupted shape information, like random horizontal flips, were beneficial for model training and improvement. In addition, we also compared the effectiveness of particular data enhancement methods, such as mixup, as shown in the Table 3, such methods of expanding data by mixing different samples and labels did not yield good results on our dataset.

Illustrations of the studied data augmentation operators. a RandomCrop, randomly cropping a region of the image; b ColorJitter, randomly adjusting brightness/contrast/saturation; c Grayscale, converting the image to grayscale; d RandomErasing, randomly masking a region; e HorizontalFlip, horizontally flipping the image; f Gaussian Blur, applying Gaussian smoothing.
Ablation study and training detail
We conducted tests to evaluate the impact of each component on the accuracy of our model, as in Table 4, The performance outcomes indicate that the inclusion of both methods during the training phase can indeed bolster the model’s capabilities to a certain degree and elevate the classification accuracy. Notably, a positive finding arises when these two methods are combined, yielding notably satisfactory outcomes. Besides, we focused on the weight parameter of the Triplet-center loss during the representation phase and the flooding level in Fig. 7.

a Top-1 accuracy as a function of the weight of Triplet-Center loss. b Top-1 accuracy as a function of flooding level during training stage for linear classification
The Triplet-center loss is a regularization term that encourages the model to learn discriminative features by minimizing the intra-class variations. In Fig. 8, through the integration of the Triplet-center loss, the model is incentivized to project similar samples in close proximity within the feature space, consequently yielding a more condensed and differentiable feature representation. This refinement has led to an enhancement in the accuracy of the classification model. The flooding strategy, on the other hand, refers to a technique used during training to prevent the model from overfitting on easy examples. It involves artificially increasing the difficulty of training samples by adding noise or perturbations to the input data. This strategy helps the model generalize better to unseen data and reduces the risk of over-reliance on specific features present only in the training set. Overall, our experimental results highlight the significance of the Triplet-Center loss and flooding strategies in improving the classification accuracy of our model. Including these strategies in the training process enhances the model’s ability to distinguish between different classes and generalize well to new, unseen data. Next, we explore the influence of Dp on the results in the representation stage. In the initial stage of the representation training process, we employ the Proj(⋅) function to convert the 2048-dimensional vectors produced by the encoder into 512 dimensions. This approach differs from the 128 dimensions utilized in SupCon22 because our sample features exhibit higher similarity and require mapping to higher-dimensional vectors to facilitate effective discrimination. By mapping the features to a higher-dimensional space, we aim to enhance the model’s ability to distinguish subtle differences among samples. The increased dimensionality provides the model with more expressive power to capture and represent intricate patterns and variations present in the data. Table 5 shows the results of different dimensions.

a Only supervised contrastive (SupCon) loss. b SupCon loss with center (SupCon + center), showing a more separable feature distribution between sand and charcoal classes.
In our series of experiments, we selected the pre-trained ResNet-50 model as our baseline. This model has proven to be more effective than other models like VGG (Visual Geometry Group Network) and ViT in distinguishing local features41. Overall, our model contains 23.5M parameters. The training configuration employs a batch size of 64 with the Adam optimizer, accompanied by a weight decay of 1e-4 and dropout rate of 0.2 for regularization. Considering the limited size of our dataset, we focused on training a more robust feature representation by conducting the characterization phase for 50 epochs. Regarding the Triplet-Center Loss margin, we initialized it based on the average distance between first-epoch feature points and their class centers, scaled by a ratio (empirically set to 0.5 × the mean distance). During training, we gradually increased the margin by 10% every 5 epochs to refine feature compactness. In the second phase of training, known as linear classification head training, we trained the model for 10 epochs. The primary goal of this phase was to reinforce the effectiveness of the flooding strategy. By training for a moderate number of epochs, we aimed to strike a balance between allowing the model to learn from the data and avoiding overfitting. For the flooding level(b), we monitored the training loss curve and selected b = 0.07 to ensure stable optimization small enough to avoid gradient suppression but large enough to prevent excessive overfitting.
The NICO dataset
The NICO dataset42 is one of the proposed OoD (Out-of-distribution) generalization benchmarks in real scenarios. The core idea behind the construction of the NICO dataset is to collect data in combinations of (subject, objects and contexts). The same category (subject object) has multiple contexts corresponding to it, describing in subject attributes such as color, shape, etc. or out-of-subject contexts such as grass, sunset, etc (in Fig. 9). Contexts actually provide biased data distributions around subjects, and by combining different (subject, objects and contexts) in the training and testing environments, we can construct different scenarios.

The images are grouped by context conditions that are not necessarily related to the object category, demonstrating the contextual bias in image classification tasks. a In cage; b In water; c On grass; d Eating; e Other.
This dataset organizes 2 superclasses (vehicles and animals), 19 classes, and 9 or 10 contexts under each category in a tree structure and collects about 25,000 images. During training, the contexts in the validation and test sets will not appear in the training set. For example, in the training dataset, we have a picture of a bird on the grass, while in the test dataset, there are pictures of birds flying. As such, context will be regarded as a simulated attribute capable of being learned, causing disruption to the model’s learning capability. As in Table 5, our method can get some accuracy improvement on the NICO dataset. This result demonstrates that our method can be extended to more future work, especially for data with correlation shift.