research design
This retrospective cohort study was conducted to identify baseline clinical characteristics that predict short-term progression in patients with advanced CKD. We retrospectively reviewed EHRs to select patients with confirmed stage 4 CKD and document subsequent progression to stage 5 CKD as study outcomes.
Study population
development cohort
The development cohort was derived from the EHR of the Second Affiliated Hospital of Harbin Medical University. Adult patients (18 years and older) who were first diagnosed with stage 4 CKD (eGFR 15-29 mL/min/1.73 m² according to KDIGO 2024 criteria) between January 2017 and December 2023 were included.
validation cohort
The validation cohort was derived from the EHR of Genertec Medical’s Harbin 242 hospital. We included adult patients initially diagnosed with stage 4 CKD from January 2016 to July 2024 using the same criteria.
For both cohorts, CKD staging was determined using ICD-10-CM discharge codes (N18.804 to N18.907) representing definitive diagnoses in the discharge summary system. Eligible patients required at least two hospitalizations. Patients with baseline diagnosis of stage 5 CKD (eGFR < 15 mL/min/1.73 m²) were excluded. There were no substantial differences between the development and validation cohorts with respect to healthcare settings, eligibility criteria, outcome definitions, and candidate predictors.
Ethical approval and reporting standards
This retrospective cohort study was approved by the Clinical Ethics Review Committee of the Second Affiliated Hospital of Harbin Medical University (YSKY2023-212). All methods were performed in accordance with relevant guidelines and regulations, including the ethical principles outlined in the Declaration of Helsinki. The requirement for informed consent was waived by the ethics committee due to the retrospective nature of the study. Reporting adhered to the STROBE guidelines (Strengthening the reporting of observational studies in epidemiology) and the TRIPOD + AI statement (Transparent reporting of multivariable predictive models for individual prognosis or diagnosis – AI enhancements).
Laboratory examination and clinical features
Candidate predictors, primarily laboratory markers, were identified through a two-step process of literature review and clinician and patient engagement. The following clinical characteristics were collected at baseline: age, gender, 24-hour urine total protein (UTP), serum albumin (Alb), albumin/globulin ratio (AGR), blood urea nitrogen (BUN), uric acid (UA), serum creatinine, blood urea nitrogen/creatinine ratio (BCR), total cholesterol, triglycerides (TG), and high-density lipoprotein cholesterol. (HDL-C), low-density lipoprotein cholesterol (LDL-C), hemoglobin (Hb), cystatin C (CysC), C-reactive protein (CRP), cholinesterase (ChE), gamma-glutamyltransferase (GGT), lactate dehydrogenase (LDH), serum sodium (Na+), serum potassium (K+), serum chloride (Cl−), red blood cells (RBC), neutrophils (Ne), red blood cell distribution width, red blood cells per high-power field (RBC-HPF), percentage of lymphocytes in white blood cells (%LYM), percentage of monocytes in white blood cells (Mon%), eosinophils in white blood cells (EOS), prothrombin time (PT), prothrombin time ratio (PTR), (P), glucose (GLU), urine specific gravity (SG), plasma fibrinogen (FIB), urinary epithelial cells (EPC), cardiac troponin I (cTnI), anion gap (AG), apolipoprotein B (APOB), direct bilirubin (Dbi).
Definition of results
The primary outcome was defined as progression from baseline stage 4 CKD to stage 5 CKD within 25 weeks (approximately 6 months) of follow-up. Patients who did not progress to stage 5 within this 25-week period were classified as non-progressors. After first stating this, we refer to this result as “short-term progress.”
The observation window was selected based on the following considerations: First, the 6-month period has been widely adopted in CKD research as a clinically meaningful time period, including in models developed from medical insurance claims data.7aggregated longitudinal EHR data in diabetic patients.8and a longitudinal EHR-based model of diabetic kidney disease progression.9. Second, at our participating hospitals, outpatient follow-up is typically scheduled every 3 to 6 months, which ensures sufficient data and consistency with daily clinical practice. Third, exploratory analyzes demonstrated that a 25-week period provided the best balance between sufficient number of events and model stability.
This definition differs from rapidly progressive glomerulonephritis (RPGN), which is defined as a 50% or more decline in eGFR within 3 months. Progression time for each patient was recorded as the date of first diagnosis of stage 5 CKD (eGFR < 15 mL/min/1.73 m²) based on ICD-10-CM discharge codes (N18.804 to N18.907) in the EHR.
Data preprocessing
Data on candidate variables such as laboratory values and ICD-10 billing codes were obtained from the EHR. Patient ID number was used as a unique identifier. Before establishing the model, I cleaned and formatted the data. Categorical variables were converted to binary dummy variables. All variables were normalized to reduce bias introduced by dimensionality using the Z-score standardization technique.10. The formula used is:
$${{\text{Z}}_{\text{i}}}=({{\text{x}}_{\text{i}}} – \mu )/ \sigma,$$
where xI is the i-th data in the dataset, μ is the mean of the feature, and σ is the standard deviation.
Model development and evaluation
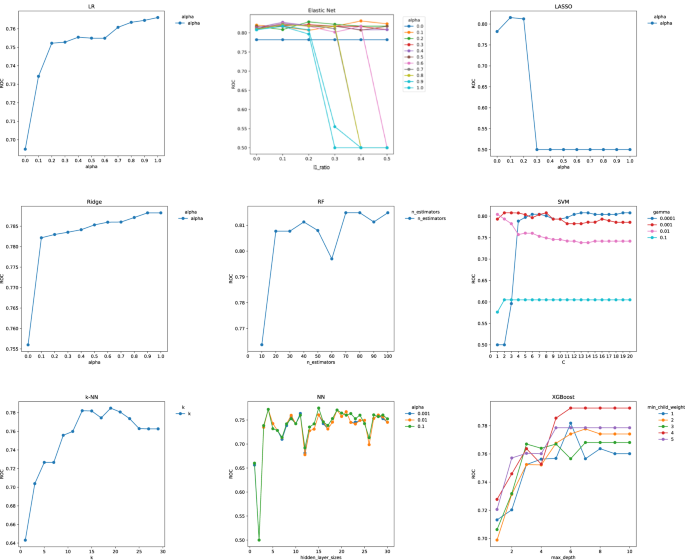
Because the study endpoints were operationalized as binary outcomes within a fixed 25-week window, the prediction task was formulated as a classification problem. The 25-week endpoint was prespecified at the protocol stage and remained fixed throughout model development to avoid subsequent redefinition of outcomes (see Outcome Definition). Nine ML algorithms, including regression-based models (logistic regression), were applied to estimate the short-term risk of CKD progression. [LR]Elastic Net, Ridge regression, LASSO), tree-based models (Random Forest) [RF] and extreme gradient boosting [XGBoost]), and additional nonlinear classifiers (support vector machines) [SVM]neural network [NN]and k nearest neighbors [k-NN]).
Within the development cohort, the dataset was randomly split into a training set (80%) and an independent test set (20%). Model training and hyperparameter tuning were performed only within the training set using a 10-fold cross-validation (CV) framework to reduce overfitting and improve generalizability. In each iteration, nine folds were used for training and one fold for validation, and the results were averaged across iterations. Since each patient provides only one baseline record, the splitting is essentially performed at the patient level, preventing data leakage across folds.
Hyperparameter tuning was performed using a grid search with 10x CV on the training set. For each candidate parameter configuration, the average area under the curve (AUC) across the fold was calculated, and the configuration with the highest average AUC was selected. The final model with tuned parameters was retrained on the full training set and then evaluated on an independent test set to assess out-of-sample performance.
To increase interpretability, Tree SHapley Additive exPlanations (SHAP) was applied to the optimal model. Local Shapley values were aggregated as the average absolute SHAP to obtain global feature importance. SHAP values quantify the contribution of each feature to the prediction, allowing you to identify the variables that have the greatest impact on the model’s predictions.
Model performance evaluation
Model performance was evaluated using AUC, sensitivity, specificity, accuracy, log loss, false positive (FP) rate, precision, F1, and average precision (AP) as recommended by clinical predictive model guidelines. AUC > 0.9, 0.7 to 0.9, ≤ 0.7 indicate good, moderate, and poor performance, respectively.11, 12. For internal validation, paired t-tests were used to compare AUC values. Within internal CVs, model AUCs were compared using paired t-tests across multiple folds. In the external validation cohort, differences in AUC were tested using DeLong’s nonparametric test for correlated receiver operating characteristic (ROC) curves (two-tailed α = 0.05). Calibration is evaluated using the Brier score and expected error of calibration (ECE), with lower values indicating better calibration. A calibration curve was plotted by grouping the predictions into five equally spaced probability bins and comparing the observed and predicted risks against a 45 degree baseline.
Variable significance was assessed in each ML model. Relative importance was quantified by assigning a weight from 0 to 1 to each variable in the model. XGBoost and RF directly derived variable importance during model training. The coefficients of the Elastic Net, LASSO, and Ridge models were used as measures of significance. An average accuracy loss method was used for the k-NN and SVM models by directly measuring the impact of each feature on model accuracy. Python (version 3.12.3) was used for model establishment and evaluation, respectively.
statistical analysis
Categorical variables were expressed as percentages, and continuous measurements were expressed as mean ± standard deviation for normally distributed variables or median (interquartile range; IQR) for non-normally distributed variables. Student’s t test was used for normally distributed continuous variables. The Kruskal-Wallis test was used for non-normally distributed continuous variables, and χ2 For categorical variables. Statistical significance was set two-tailed P< 0.05.