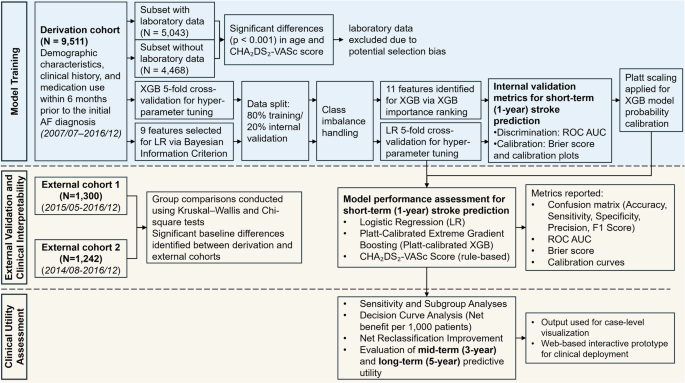
This study was conducted in accordance with the Transparent Reporting of a multivariable prediction model for Individual Prognosis Or Diagnosis extended for Artificial Intelligence (TRIPOD + AI) guidelines to ensure rigorous development and validation of AI-based prediction models39. The overall study workflow is illustrated in Fig. 1.
Study population and data source
This study utilized data from the National Taiwan University Hospital Integrated Medical Database (NTUH-iMD), a comprehensive electronic health record system that spans multiple branches of the National Taiwan University Hospital (NTUH) healthcare system. The derivation cohort (n = 9511) for model development was assembled from NTUH, a tertiary medical center located in Taipei. Two external validation cohorts were constructed from regional branches: the NTUH Hsin-Chu Branch (external cohort 1; n = 1300) and the NTUH Yun-Lin Branch (external cohort 2; n = 1242). These hospitals are located in distinct geographic regions outside of Taipei, allowing evaluation of model performance in diverse care settings and patient population. The NTUH-iMD includes clinical data from NTUH since January 2007, from the Yun-Lin Branch since February 2014, and from the Hsin-Chu Branch since November 2014. External validation cohorts were collected during different time periods than the derivation cohort, allowing for temporal validation. Disease diagnoses were coded using the International Classification of Diseases, Ninth Revision, Clinical Modification (ICD-9-CM) prior to 2016, and the International Classification of Diseases, Tenth Revision (ICD-10) from 2016 onward. Eligible patients were adults aged ≥20 years who received a new diagnosis of AF, identified from both outpatient and inpatient encounters. The index date was defined as the date of the initial AF diagnosis, either the date of the outpatient visit or the admission date of the index hospitalization, and marked the start of the follow-up period.
All personally identifiable information within NTUH-iMD was encrypted in accordance with Taiwanese data protection regulations. Data analyses were conducted using de-identified datasets. Given the retrospective nature of the study and the absence of direct patient involvement or influence on clinical care, informed consent was waived. The study protocol was reviewed and approved by the Research Ethics Committee of NTUH (No. 202010027RINA). To ensure fairness and generalizability, it is notable that AF management, including anticoagulation therapy and stroke-related care, is fully covered under Taiwan’s National Health Insurance program, which has a population coverage rate of approximately 99%. This universal coverage reduces access-related disparities in care, thereby enhancing fairness in outcome assessment and generalizability of the prediction models.
Predictors and outcomes
Demographic and clinical information, including age, sex, comorbidities, and medication use within six months prior to the index date, was extracted from the NTUH-iMD. All predictor variables were derived strictly from data recorded on or before the index date, using a 180-day look-back window to identify baseline characteristics. Laboratory values, such as complete blood cell counts and renal function indicators, were also collected when available. Comorbid conditions were identified using the Elixhauser comorbidity definitions40. To ensure model stability and clinical relevance, only comorbidities and medications with a prevalence greater than 2.5% were included in the final analysis. Features with prevalence between 1 and 2.5% were retained if their distribution suggested disproportionate enrichment in the outcome group. The CHA₂DS₂-VASc score was calculated for each patient on the index date. In addition to baseline predictors, DOAC use was recorded during the specified follow-up period or prior to the occurrence of stroke or death, and was used in subsequent stratified subgroup analyses. Patients were followed from the index date, defined as the date of initial AF diagnosis, until death or the end of the observation period (December 31, 2021), whichever occurred first. The primary outcome was the occurrence of ischemic stroke within 1 year after the index date. Only stroke events that occurred after the index date were included as outcomes. Events recorded on the same day as, or prior to, the index date were considered part of the patient’s clinical history and not counted as outcome events. Secondary outcomes included all-cause mortality within 1 year, as well as ischemic stroke and all-cause mortality within 3 and 5 years following the index date. Outcome and predictor data were extracted algorithmically from the NTUH-iMD, and blinding was not feasible. To reduce bias, definitions were standardized and applied uniformly across cohorts.
Statistical analysis
Baseline characteristics were reported as means with standard deviations (SD) for continuous variables and as counts with corresponding percentages for categorical variables. To assess potential selection bias related to missing laboratory data, comparisons between patients with and without available laboratory test results were performed using independent two-sample t-tests for continuous variables and Chi-square tests for categorical variables. SMDs were also calculated to quantify the magnitude of between-group differences. In the derivation cohort, the normality of the continuous variable was assessed using Kolmogorov–Smirnov test in the non-stroke group (N = 8063) and the Shapiro–Wilk test in the stroke group (N = 1448). As the only continuous variable, age was not normally distributed, differences between groups were compared using the Mann-Whitney U-test. Categorical variables were analyzed using the Chi-square test. Comparisons of baseline characteristics across the derivation and external validation cohorts were conducted using the Kruskal–Wallis test for continuous variables and the Chi-square test for categorical variables. When pairwise post hoc comparisons were necessary, Holm-adjusted p-values were applied to correct for multiple testing.
To evaluate whether the trained LR or XGB model exhibited overfitting, a bootstrap test with Bonferroni correction was used to compare the AUROC between 2 independent samples: the hold-out test set (20% of the derivation cohort) and each external validation cohort. This comparison was conducted separately for the LR and XGB models. DeLong’s test was applied to evaluate differences in the AUROC between models within each external validation cohort. Bonferroni correction was used to adjust for multiple comparisons across LR, XGB, and CHA₂DS₂-VASc models. This approach allowed formal evaluation of heterogeneity in model discrimination across derivation and external validation datasets. To assess long-term predictive utility and clinical interpretability, patients were stratified into high- and low-risk groups based on 1-year stroke risk predicted by either the LR model or the CHA₂DS₂-VASc score. Within each group, cumulative stroke incidence over 3 and 5 years was plotted by DOAC usage. Kaplan–Meier estimates were used, with stroke as the event of interest and censoring for competing risks. Differences between DOAC users and non-users were evaluated using the log-rank test. As this test does not account for competing risks (e.g., death), Gray’s test was additionally performed and reported in the Results section. All statistical analyses were conducted using R (version 4.4.0) with RStudio.
Model development and validation
Model development was conducted using the derivation cohort from NTUH in Taipei. Two supervised ML algorithms were employed: LR, selected for its strong clinical interpretability, and XGB, chosen for its ability to model complex non-linear relationships. Both models were developed using structured clinical variables, including age, sex, clinical history, and medication use, to ensure generalizability and ease of clinical integration.
For the LR model, feature selection was performed using a stepwise strategy based on the BIC41. The process was repeated across multiple randomized subsets of predictors, with all possible feature combinations (up to 12 features per subset) evaluated using logistic regression. The combination with the lowest BIC in each iteration was selected. Features that appeared in at least 3 iterations were retained in the final model to balance model parsimony and performance. Continuous variables were standardized using z-score transformation to ensure comparability of coefficient estimates in the LR model. For the XGB model, predictors were ranked according to gain-based feature importance. To determine the optimal number of features, models were iteratively trained using an increasing number of top-ranked predictors, and the configuration yielding the highest cross-validated AUROC was selected. Hyperparameter tuning for both models was performed using grid search with 5-fold cross-validation. Class imbalance was addressed using built-in parameters specific to each algorithm. A complete list of hyperparameters is provided in Supplementary Table 2.
Internal validation was performed using a hold-out test set (20% of the derivation cohort), and external validation was conducted using two independent cohorts from the NTUH Hsin-Chu Branch (external cohort 1; n = 1300) and the NTUH Yun-Lin Branch (external cohort 2; n = 1242). Model predictions were generated using the predict_proba() method from the scikit-learn LogisticRegression model and the XGBClassifier in the xgboost library. For both models, the predicted probabilities of 1-year stroke occurrence (i.e., positive class) were used as the primary output. To compute classification metrics (e.g., accuracy, sensitivity, specificity), a probability threshold of 0.5 was applied. This threshold was chosen as a conventional default to reflect clinical decision points and allow comparison across models.
Primary model performance was assessed using the AUROC, while the AUPRC was used to evaluate the trade-off between precision and recall in the context of class imbalance. 95% CIs were calculated via bootstrapping. Additional discrimination metrics at a threshold of 0.5, including accuracy, sensitivity, specificity, precision, and F1 score, were reported (Supplementary Table 3). Model calibration was evaluated using Brier scores and calibration curves. The Brier score quantified the overall accuracy of probabilistic predictions, while calibration curves visually assessed the agreement between predicted probabilities and observed outcomes across risk strata. For the LR model, no post-hoc calibration (e.g., slope or intercept adjustment) was performed, as it demonstrated adequate calibration during internal validation. In contrast, to improve probability calibration, Platt scaling (sigmoid calibration) was applied to the final XGB model using the calibration subset42. The CHA₂DS₂-VASc score served as the benchmark for comparison across all cohorts, with its scoring criteria detailed in Supplementary Table 4.
Sensitivity and subgroup analyses
Since ischemic stroke plays a role as both a predictor (prior stroke history) and an outcome (post-AF stroke event), a sensitivity analysis was conducted to further reduce the risk of reverse causality or early misclassification by excluding outcome events that occurred within the first 3 days after AF diagnosis. To assess model fairness, we pooled the two external cohorts (n = 2542), stratified patients by sex (female n = 1138; male n = 1404), and compared discrimination (AUROC) and calibration (Brier score) between subgroups. An unpaired DeLong test was used to evaluate whether observed AUROC differences were statistically significant. Additionally, we conducted a subgroup analysis by stratifying the validation cohort based on the presence (n = 406) or absence (n = 2136) of prior ischemic stroke at baseline. This analysis evaluated model performance in stroke-naïve versus stroke-experienced patients and assessed whether prior stroke history significantly influenced discrimination metrics.
Clinical utility and interpretability
To assess the clinical utility of the prediction models, DCA was performed to quantify the net benefit of model-guided decisions across a range of threshold probabilities, expressed per 1000 patients43. The net benefits of the LR and XGB models were compared with those of the CHA₂DS₂-VASc score and with default strategies of treating all or no patients44. Net benefit reflects the number of additional patients correctly identified for treatment per 1000, accounting for the trade-off between true positives and the harm of false positives at each threshold. Additionally, NRI was calculated to evaluate whether the ML-based models improved individual risk stratification compared to the CHA₂DS₂-VASc score45. All model development, validation, and clinical utility analyses were conducted using Python (version 3.12) within Jupyter Notebook.
To assess longer-term predictive utility and clinical interpretability, patients were stratified into high- and low-risk groups based on the predicted 1-year stroke risk generated by either the LR model using a threshold of 0.2, or the CHA₂DS₂-VASc score. The 0.2 cutoff was selected based on supporting evidence from both the NRI and DCA. NRI values remained robust between thresholds of 0.2 and 0.6 across external validation cohorts, while higher thresholds showed diminished or even negative reclassification performance (Supplementary Table 5). Similarly, DCA plots demonstrated that a threshold near 0.2 yielded the highest net clinical benefit per 1000 patients (Fig. 4). Within each risk stratum, cumulative incidence curves of ischemic stroke were plotted over 3-year and 5-year follow-up periods, further stratified by DOAC usage. These visualizations were used to examine whether model-derived risk classifications aligned with clinical outcomes and anticoagulant prescribing patterns over time.
Finally, to support clinical integration and user-centered interpretability, individual-level risk predictions were incorporated into a prototype decision support tool. A web-based interactive interface was developed using Python Streamlit, allowing clinicians to visualize patient-specific stroke risk estimates and risk strata. A demonstration video of the interface is provided in the Supplementary Material to illustrate potential clinical deployment and shared decision-making scenarios.