High-confidence template matching for in situ macromolecule localization
We comprehensively tested our TM pipeline on tomograms of Dictyostelium discoideum and exemplifying tomograms from Schizosaccharomyces pombe and human tissue culture (Hek293) cells obtained from lamellae milled with cryo-focused ion beam microscopes4 (see Fig. 1 for the workflow and “Methods” section for details on data acquisition). Starting from a library of the best available templates for a series of candidate features, we performed TM of each template in a tomogram independently and assigned particle identities to the points with high constrained cross-correlation (CC). The locations and orientations of the assigned peaks permit the visualization and analysis of the spatial interactions of the features. We used a total of 21 templates, on 3 different species (Table 1) at different voxel sizes and with multiple search parameters including the number of orientations and filters (see “Methods” section for details). Templates in the library were obtained from different sources including subtomogram averaging (STA), homology modeling, the protein data bank (PDB)33, the electron microscopy data bank (EMDB)34, and molecular dynamics simulations (see “Methods” section for details).

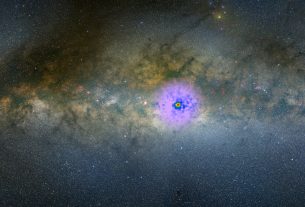
A tomogram (slice shown in the top left) is cross-correlated independently with each template in the library (bottom) to identify points with high constrained cross-correlation values (zoom-ins with CC z-scores at the bottom). From the z-score maps, 3D localization maps (top right) are generated for visualization65 and analysis of the spatial interactions of proteins and their complexes. Source data are provided as a Source Data file.
We used the STOPGAP35,36 software framework, and re-implemented it as a GPU-accelerated version (https://gitlab.mpcdf.mpg.de/bturo/gapstop_tm), to calculate the actual cross-correlation between templates and tomograms, maximizing the cross-correlation of the template according to its orientation and positions. This framework takes into account the missing wedge, angular tilt step, defocus, and electron dose (see “Methods” section and ref. 36 for details). For each template, with optimized search parameters (see next section), peaks several standard deviations above noise appear in the z-score map. High-confidence peaks correspond to the position where the center of the template is placed to best reproduce the data from the tomograms.
Figure 1 summarizes the TM procedure. We used a library that includes templates for the NPC37, the 80S ribosome4, and the nuclear envelope obtained by STA from tomograms of D. discoideum. For the proteasome38 and microtubule39, we used the previously reported human structures (PDB-id: 6rgq [https://www.rcsb.org/structure/6RGQ] (human 20S proteasome structure), PDB-id: 3jar [https://www.rcsb.org/structure/3JAR] (microtubule structure), respectively). For the vault, we created a density map starting from an atomic model generated by homology modeling. With each of the templates, we performed TM, initially at 4-binned data with a voxel size of 8.704 Å and then also at higher resolution (2-binned 4.352 Å/voxel and unbinned 2.176 Å/voxel). By progressing hierarchically to higher resolution, we aimed to capitalize on the high signal content of the data collected with the latest-generation hardware.
We transformed the cross-correlation volumes into z-score maps by subtracting the average and then dividing by the standard deviation (σ), both calculated for each template across the entire map. We use z-scores unless otherwise stated, as they quantify peak heights relative to the background in a particular tomogram. In the z-score representation, a peak at the center of the NPC is typically ~10 standard deviations (\(\sigma\)) above the map noise, while the vault and the ribosome have peaks with z-score values of ~30 and ~40, respectively (Fig. 1). For isolated objects such as the vault or ribosome, the peaks appear insular and sharp, while membrane or microtubules show elongated and continuous peaks consistent with the extended and repetitive character of the objects. Remarkably, TM identifies also low-density and low-abundance particles with high fidelity (Fig. 1). Automatic and semi-automatic particle detection algorithms have been widely tested for high-contrast and abundant macromolecular complexes in tomograms (e.g., ribosomes). However, fundamental macromolecular complexes such as the NPC or vault, which are scarce (2–3 copies per tomogram) and have low density, are particularly challenging. With optimal parameters, TM results in strong peaks for both macromolecular complexes (Fig. 1) and finds all positions identifiable by expert inspection. This finding is important in two ways: firstly, these complexes are fundamental for our understanding of cellular function, and secondly, given their low abundance, harnessing all the particles is key for visual proteomics analysis.
Assessment of parameters that impact on the performance of TM
The success is dependent on the accurate tuning of various parameters, but clear guidelines on how to adjust those are missing. We analyzed various parameters and found that optimal TM requires systematic tuning of the bandpass filters (Fig. 2a, b), template (Supplementary Figs. 1–4) and mask size (Fig. 2c), voxel size (Supplementary Fig. 5) and angular sampling (Supplementary Figs. 5 and 6). Optimal parameter values depend on the quality of the data as well as the size and shape of the object (Fig. 2d–f and Supplementary Figs. 1–4).

a–c Dependence of the average constrained cross-correlation peak height (z-scores) for 80S ribosomes, NPC subunit, half vault, and microtubule on the high-pass (a) and low-pass filters (b), and on the diameter of the spherical mask for the ribosome and a cylindrical mask for the microtubule (c). In a no low-pass filter was applied, and in b no high-pass filter. d Schematic representation of the overlapping voxels (orange) when a microtubule is rotated around its optimal orientation by 20 deg. e, f Dependence of the constrained cross-correlation of a template with itself (in silico evaluation) as a function of the fraction of overlapping voxels and the angular distance (f). e, f present cross-correlation coefficients (and not z-scores) for the template matched against itself, not the tomogram. In e the CC values for all the rotations in a 10 degrees grid are shown, in f the average of the CC values for all rotations sampled in a 1-degree grid and binned every 2 degrees. For the average, the number n increases as a function of the angular distance (from n = 4 at the pole to up to n = 306 at 50 deg). In all cases, error bars correspond to one standard deviation. In a–c n = 10, 45, 4, and 16 for NPC subunit, ribosome 80S, half vault, and microtubule, respectively. Source data are provided as a Source Data file.
We first assessed the impact of frequency contents. For the ribosome, NPC subunit (C8-symmetric rotational segment), half vault, and microtubule templates, peaks decay with increasing high-pass filter, i.e., when low-resolution information is gradually removed (Fig. 2a). The low-pass filter has a less pronounced effect, although the z-score slightly increased when high-resolution information was included (Fig. 2b). This analysis implies that for ribosome, NPC subunit, vault and microtubule, TM detection benefits from retaining higher resolution information in the data.
Regarding mask sizes, we found that mask tightness has a negligible effect for ribosomes and microtubules as long as the template is completely contained (Fig. 2c). However, for membrane-associated structures such as the NPC, a shaped mask may exclude the membrane from the template, improving TM performance (Supplementary Fig. 7).
Angular scanning should be optimized in a template-specific manner
The above analysis indicated that the impact of parameters such as voxel size or the number of orientations sampled depends on the template mass, shape, and size. To systematically investigate this, we developed a Python-based tool to evaluate TM parameters in silico (see details in Methods and examples in Supplementary Figs. 1–4). The in silico evaluation of multiple templates showed that the CC depends almost linearly across different templates on the fraction of overlapping voxels between the rotated template and the object (Fig. 2d, e), a relation that would be exact if voxel intensities were strictly zero or one. The number of overlapping voxels depends on both angular sampling and object shape (Fig. 2e). This effect is particularly pronounced for hollow objects such as the vault and elongated structures such as protofilaments. In such cases, even small rotations lead to a large decrease in the number of overlapping voxels and hence in the cross-correlation. Thus, templates that require finer orientation sampling to be localized with high confidence will demand more computational power for detection with similar performance (Supplementary Figs. 8 and 9). We conclude that general recommendations for sampling during template matching cannot be made. Instead, optimal angular sampling is highly dependent on template shape and should be individually tested. Therefore, our pipeline allows us to optimize parameters in silico in a template-specific manner, prior to analyzing experimental data, to then channel the available computational power toward those templates that require more fine-grained scanning. For example, the variation of cross-correlation with angular distance (Supplementary Figs. 2b, 3b, and 4b) provides an initial guide for estimating axis-dependent angular steps. Angular steps that result in <40% decrease in cross-correlation are considered sufficient, as illustrated for the Vault (Supplementary Figs. 2 and 9) and the NPC subunit (Supplementary Figs. 4 and 8). Our Python-based tool will allow users to do this systematically for any template.
Quantitative localization of ribosomes
Although the qualitative detection of ribosomes was reported4, reliable particle detection with minimal false negative rates is a prerequisite for quantitative analysis of the localization and interaction of molecular complexes. We assessed the ability of optimized TM to locate individual ribosome positions and orientations by comparing the results of TM with existing annotations of the cytosolic 80S ribosomes for D. discoideum4. The annotations were obtained in a multistep classification procedure, with an initially oversampled set of ribosomes, using Relion40, as described in ref. 4, which resulted in a map with resolutions up to 4.5 Å.
Figure 3 shows the results for TM on 4-binned data (8.704 Å/voxel). Motivated by our in silico evaluation (Supplementary Fig. 5), we assessed the effect of the number of orientations by sampling the rotational space in angular steps of 30, 20, 10, and 5 degrees (576, 1944, 15192, and 119952 orientations) and selected TM peaks corresponding to local maxima in the z-score map that are above a threshold (Fig. 3) and clearly inside the lamella borders. We considered a particle in the ground truth as TM detected if it was located within 10 nm (~1/3 of the ribosome diameter) of a TM peak. With increased numbers of orientations, the z-scores of the peaks increased and with that the percentage of TM-detected particles (Fig. 3c, d; see also Supplementary Figs. 5 and 6). With orientations separated by ~5 degrees, TM detected ~95% of the 437 previously annotated particles with a mean distance to the TM peak of (3.73 ± 1.57) nm (Fig. 3f) and with orientations that closely matched the annotated orientations (Fig. 3e). Consequently, the averages of the particles detected and orientated by TM recapitulate the density of the 80S ribosome with high sensitivity and accuracy without the need for a multistep classification process (Fig. 3h, i), similar to recent reports41. This suggests that TM can be used for a quantitative accounting of the particles present in the tomograms, whereby false negative detections appear to be minimal. Our analysis shows that the comprehensive search of the rotational space enhances the quantitative capability of TM41 in a trade-off with increased computational cost.

a Tomogram slice showing abundant ribosomes. b Slice of the z-score map obtained from template matching using the template of the 80S ribosome shown in (g). c Superimposition of the peaks obtained from template matching (blue circles; sampled every 5 degrees and with a cross-correlation threshold z-score\(\ge\)30) and the high-confidence localizations obtained from an expert multiple-step alignment using Relion40 reported in ref. 4. d Percentage of the high-confidence Relion particles detected within 10 nm of the TM peaks as a function of the rotational sampling (i.e., number of orientations). e, f Histograms of angular (e) and Euclidean distances (f) from the TM peaks to the annotated Relion particles, respectively, each obtained for a 5-degree angular sampling. g Template for 80 S ribosome. h, i Ribosome structure obtained by averaging the particles from TM from (c) (h, no further processing) superimposed on template (i). Source data are provided as a Source Data file.
High-confidence TM reveals membrane compartments
Accurate segmentation of membranes is crucial for visualizing cellular landscapes, and to the best of our knowledge, TM has not yet been used to detect cellular membranes. We tested TM for membrane segmentation with models of different origins and sizes (Table 1, Figs. 1 and 4). The first template was the map created from a frame in the trajectory of an atomistic simulation of a membrane in explicit water (atomic model). The second and third models were averages of the nuclear envelope obtained by subtomogram averaging with diameters of 43.5 nm (small STA) and 87 nm (large STA), respectively. For comparison, during TM, cylindrical masks with a diameter of 34.8 nm were used for both the atomistic and the small STA, while a cylindrical mask with a diameter of 76.5 nm was used for the large STA (see “Methods” section).
The inner and outer membranes of the nuclear envelope were detected using any of the three templates (atomistic, small STA, large STA; see Supplementary Movie 1). The atomistic and small STA templates performed roughly on par. Increasing the number of orientations (20, 10, and 2 degrees at 4-binned data with 8.704 Å/voxel) consistently decreased the background noise (Fig. 4), sharpening the peaks, and increased the confidence in the TM detection. False positives for the small templates (atomistic, small STA), e.g., from a microtubule segment (Fig. 4 left; see also Fig. 1) are suppressed by using the large STA template (or, visually, by recognizing the lacking 2D extension). However, the large STA model gives only a weak signal for curved membranes, pointing to the need for an expanded model set of membrane patches of varying curvature.

Results in the top, middle, and bottom row were obtained for templates constructed from a simulated atomic membrane and STAs of the nuclear membrane with diameters of 50 (small STA) and 100 (large STA) voxels, respectively (8.704 Å/voxel). The results from left to right correspond to increasing angular sampling of 20, 10, and 2 deg, respectively. Note that the peaks at the upper right corner originate from a highly curved vesicle while the two stripes on the right-hand side of the cross-correlation maps (z-scores) are a microtubule and not a membrane (see Fig. 1). Source data are provided as a Source Data file.
Although computationally expensive compared to other segmentation methods, template matching for membranes has several strengths. For example, the template matching output could be used as an initial annotation for training deep-learning algorithms. In addition, TM not only predicts the positions of the membranes in the tomogram but also provides voxel-by-voxel normal vectors, which in turn enables a detailed analysis of the local properties of the membranes. The latter could also be used as an automatic input for triangulation methods and/or as a starting point for simulations of membrane dynamics.
Detection of subunits and conformer subpopulations
We tested the ability of TM to localize subunits and assign substates of ribosomes, the NPC, and microtubule fragments. We generated templates for the subunits of the D. discoideum NPC according to its C8 symmetry, microtubule protofilaments, the small (40S) and large (60S) ribosomal subunits, and for two prominent 80S ribosome states capturing the ratchet-like motion essential for protein synthesis42.
For the ribosomal subunits, we performed TM on 2-binned data (4.352 Å/voxel) with orientations every 10 degrees, since TM on 4-binned tomograms showed inconclusive peaks. A sub-volume of the tomogram was analyzed independently with three different templates: 80S, 60S, and 40S (Fig. 5). Similar to the 4-binned data (Fig. 3), the TM localized 96.9% of the 80S annotated ribosomes with z-score peaks up to 114 (Fig. 5b, c). Furthermore, when comparing the positions and orientations of the subunits, TM correctly predicted the location of the subunits and their relative orientations (Fig. 5d). Small but noticeable differences between the orientations of the subunits with respect to the position of the 80S reflect the limited angular sampling. Finally, using all the TM peaks detected by the 60S (90 particles) or only the unannotated (34 particles) TM peaks detected by the 60S, we recovered features from the 80S (see Supplementary Fig. 10), demonstrating the high quality of the particles found.

a Tomogram slice. b, c TM finds the positions of the 80S (green) ribosomes annotated with high confidence (96.9% of particles within 2.4 ± 1.5 nm). Two more templates were tested, (i) the small (40S – pink) and (ii) the large (60S – blue) ribosomal subunits. d Calculated position and rotation of the 40S and 60S mapped back to the tomogram compared to the calculated orientation for 80S from TM. Note that the positions and orientations displayed the subunits and the 80S were obtained from independent TM calculations. e Comparison of the assignment of the ratchet-like rotational states of the ribosome from TM using a Gaussian mixture model43 with existing annotations4. f Templates for rotational states. g Ratio of TM scores as function as function of assigned rotation state (line: median; box: interquartile range; error bars: range, n = 28, 46 for rotated and unrotated, respectively). h Consistency of assignment (annotated as rotated: blue; unrotated: orange). Source data are provided as a Source Data file.
By comparing the relative TM z-scores on 2-binned data (4.352 Å/voxel) with orientations every 10 degrees, we could correctly assign the ratcheting state of the small subunit of individual ribosomes in space (Fig. 5e–h). Two known representative ratcheting states of the D. discoideum ribosome were used as templates4: rotated (EMD-15815 https://www.emdataresource.org/EMD-15815) and unrotated (EMD-15812 https://www.emdataresource.org/EMD-15812), and the states were assigned using the expectation-maximization algorithm (see “Methods” section for details) to predict the mixture of subpopulations (Fig. 5g), similar to previous studies43. Although the rotated and unrotated templates share most of the density with only a slight rotation of the 40S (Fig. 5f), the TM assignments differentiated between the rotated and unrotated states, matching the existing annotations in 77.7% and 82.4% of cases, respectively (Fig. 5e, h). It is worth noting that there are other intermediate rotation states, and the binding of multiple cofactors to the ribosome along the translation cycle4 may affect the TM z-scores and ultimately the state assignment, which may account for non-matching particles.
TM also finds NPC subunits. Directly from the z-score maps, we could detect the C8-symmetric rotational segments of the NPC (Fig. 6a) with high confidence, as demonstrated by performance metrics (Supplementary Fig. 7), after performing TM on 4-binned tomograms (8.704 Å/voxel) and sampling orientations every 10 degrees as suggested by our in silico analysis. Interestingly, no peaks were detected using an NPC from a different species as a template (Supplementary Fig. 7), highlighting the role of template information content.

a, b Perspective view of the 3D constrained cross-correlation map obtained from template matching using an NPC subunit (a) and microtubule section (b). The templates are shown on the left-hand side of each panel. For the microtubule, two templates were used: a protofilament and an αβ-tubulin dimer. The 8- and 13-fold symmetries for the NPC and the microtubule, respectively, emerge naturally from template matching (zoom-ins with numbered peaks). Note that two NPCs at the edge of the lamella have only 7 (left) and 5 (center) detectable subunits left after the milling process. The NPC subunit and protofilament templates were cut from the whole NPC and microtubule templates, respectively. The αβ-tubulin dimers in (b) were obtained by masking the protofilament template (orange box). c From the 3D localization maps generated for visualization4 and analysis, TM finds ribosomes inside vaults indicated by the squares (i, ii and iii clockwise from left), see also Supplementary Fig. 14. In (i), the vault (magenta; z-score=\(54\)) containing the ribosome (green; z-score=\(63\)) is near a NPC (gray) and the nuclear envelope (purple). In (ii) and (iii), the vaults (z-score=\(32\) and z-score=\(59\)) containing the ribosomes (z-score=\(46\) and z-score=\(77\)) are in the cytoplasm. The templates used for the ribosome and the vault are identical to those used in Fig. 1. Here the vault is shown with a lower threshold level to visualize the ribosome on the inside.
To investigate the effect of template size, we used segments of microtubules differing in size. Using appropriate sampling (2-binned, 2.446 Å/voxel, 5 degrees), TM resolved peaks of the individual αβ-tubulin as distinct peaks with the 13-fold symmetry of microtubules (Fig. 6b) when the protofilament template was used. This is apparent in tomograms of both, D. discoideum and Hek293 cells (Supplementary Fig. 11). We further masked a single αβ-tubulin dimer (Fig. 6b and Supplementary Fig. 12). Despite the low combined mass of only 100 kDa, TM achieves good statistics both in terms of true positives and (likely) false negatives. Although the subunit segmentation along the filament was blurred, it is evident in the longitudinal z-scores along the axial lines passing through protofilaments that the local maxima correspond to the subunits in the microtubule lattice for both the protofilament template and the αβ-tubulin dimer (Supplementary Fig. 12). When cylindrical segments of different sizes are used as template, microtubules are detectable at lower resolution (8.704 Å/voxel, 10 degrees), but the true positive rate is reduced with decreasing template size (Supplementary Fig. 13).
Overall, these results demonstrate that TM can find subunits of macromolecular complexes with high accuracy and precision.
High-confidence TM identifies vault-encapsulated ribosomes in situ
The biological function of the vault particle remains mysterious. A few interactors binding to the inside surface have been reported44,45 which in line with its capsule-like morphology has led to speculations that vaults may enclose other particles and transport cargo within the cell. To the best of our knowledge, however, evidence for vaults encapsulating cargo in situ is yet missing. Three of the vaults in the tomogram of Figs. 5a and 6c contain 80S ribosomes with highly significant z-scores (vaults: 54\(,32\), and 59 ribosomes: \(63\), \(46\), and \(77\), in Fig. 6c(i)–(iii), respectively). Note, that TM reports excellent performance metrics for the identification of ribosomes and vaults (Supplementary Fig. 14). These findings support the hypothesis that vaults can be cargo-loaded in situ. Whether the encapsulation occurred during vault biogenesis or by transient opening remains to be further investigated.
High-confidence TM identify macromolecular complexes in other species: comparison with state-of-the-art tools
We further tested the versatility and performance of high-confidence TM on a recently published tomographic dataset of S. pombe30. We selected this dataset because it was used to test two recent deep-learning tools to localize particles in tomograms (DeePiCt30 and DeepFinder29) and annotations exist. We performed TM for ribosomes (80S), fatty acid synthase (FAS), membrane, and NPCs on a tomogram reconstructed from the tilting series reported for S. pombe (EMPIAR-10988 [https://www.ebi.ac.uk/empiar/EMPIAR-10989/];TS_043)30 (see Methods and Supplementary Fig. 15). Templates for S. pombe ribosomes (EMD-14426 [https://www.emdataresource.org/EMD-14426])30, FAS (EMD-14412 [https://www.emdataresource.org/EMD-14412])30 and the NPC (EMD-11373 [https://www.emdataresource.org/EMD-11373])46 were obtained from the EMDB34. For the membrane we used the large STA template described above (see Fig. 4). From the whole NPC template, a smaller template of a rotational segment was extracted in a procedure analogous to Fig. 6a. TM was performed on one 4-binned tomogram (13.48 Å/voxel) for all the templates. We used angular steps of 5 degrees for the 80S, FAS, and NPC subunits, and 2 degrees for membranes.
For the ribosome localization, TM had an F1 score of 0.77, which is comparable to DeepFinder (median F1 = 0.83) and DeePiCt (median F1 = 0.79). TM performs significantly better on FAS (F1 = 0.70, Supplementary Fig. 15) than DeepFinder (median F1 = 0.11) and DeePiCt (median F1 = 0.46). Finally, in contrast to DeepFinder and DeePiCt that faced challenges locating the NPC, TM demonstrated its capability to precisely identify the individual NPC subunits with z-scores >20 (Supplementary Fig. 15d), as confirmed by expert inspection. TM also localized membranes with a generic, unadjusted template. All results for DeepFinder and DeePiCt were taken from ref. 30.