Working flow chart
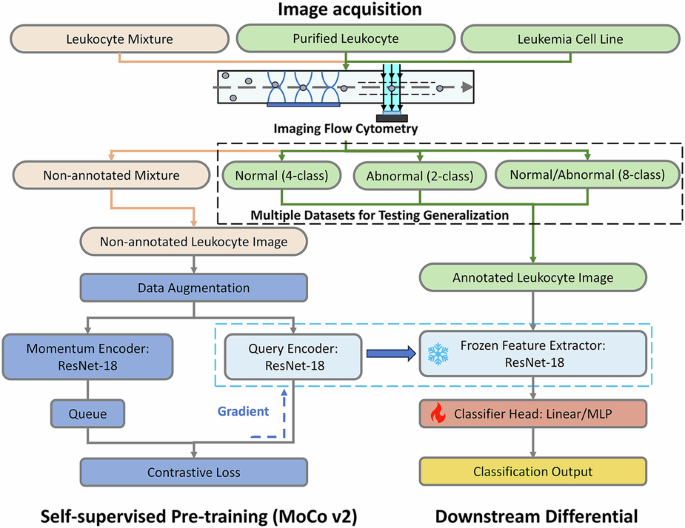
As shown in Fig. 1, the overall workflow of this study consisted of three main phases: (a) image acquisition, (b) self-supervised pre-training, and (c) multi-dataset downstream leukocyte differential. Initially, leukocyte samples—including mixed leukocytes, purified leukocytes, and leukemia cell lines—were captured using a custom-built imaging flow cytometry system. Through multiple independent experiments, one non-annotated dataset (derived from leukocyte mixtures) and three annotated datasets were constructed for pre-training and generalization evaluation.

a In image acquisition, images of leukocyte mixtures, purified leukocytes, and leukemia cell lines were captured by a home-developed imaging flow cytometry. Through multiple independent experiments, one non-annotated leukocyte mixture dataset along with three annotated datasets, which were utilized for testing model generalization, were constructed. b In self-supervised pre-training, a MoCo v2-based contrastive learning framework was conducted on the non-annotated leukocyte mixture dataset. This framework utilized a ResNet-18 as the shared backbone network, comprising a query encoder updated by backpropagation and a momentum encoder with momentum-updated parameters. After pre-training, the query encoder was saved as a feature extractor. c In downstream differential, the three annotated datasets were used independently to train and evaluate to validate the generalization. During fine-tuning, the pre-trained ResNet-18 weights were frozen, and only a lightweight linear classifier or MLP head was trained for each specific task
In the self-supervised pre-training phase, a Momentum Contrast (MoCo v2) framework36 was employed to learn representative features from the non-annotated dataset. This framework utilized a ResNet-1839 architecture as the shared backbone network, consisting of a query encoder (updated via backpropagation) and a momentum encoder (updated via momentum-based moving average). Following pre-training, the pre-trained query encoder was subsequently saved as a fixed feature extractor.
For the downstream differential phase, the pre-trained weights were frozen, and only a lightweight linear classifier or multilayer perceptron (MLP) head was trained and evaluated on each of the three annotated datasets to validate cross-dataset generalization.
Image acquisition and dataset composition
The image data in this study were acquired by a custom-built imaging flow cytometry (Fig. 1a). The cytometry utilized a PZT-based acoustic focusing method, which ensured that cells passed sequentially through the depth-of-field region at the center of the channel, enabling the high-throughput acquisition of high-quality, in-focus bright-field cell images. The samples tested included leukocyte mixtures, purified leukocytes, and leukemia cell lines. For detailed configurations regarding materials, cell preparation, and the imaging flow cytometry setup, please refer to our group’s previous publication40. Specifically, the original images were single-channel grayscale with a resolution of 200 × 200 pixels and 8-bit depth. For storage, the images were replicated into 3-channel format and saved as PNG files.
Through multiple experiments, four mutually independent datasets were constructed: one non-annotated dataset for self-supervised pre-training and three annotated datasets for downstream differential tasks to test generalization of pre-training feature extractor. No cell images were reused across these datasets. The self-supervised pre-training dataset consisted of images from leukocyte mixtures obtained from four healthy volunteers and contained only non-annotated images of normal leukocytes. The three downstream differential datasets all comprised annotated leukocyte images. Normal leukocyte types came from purified leukocytes isolated via fluorescence-activated cell sorting after red blood cell lysis of whole blood, while abnormal leukocyte types were derived from in vitro cultured leukemia cell lines. All three datasets were independent and non-overlapping.
The first dataset included the four most abundant normal leukocyte types—EOS (eosinophil), LYM (lymphocyte), MON (monocyte), and NEU (neutrophil)—and served as a four-class baseline for normal cell classification. The second dataset contained two types of leukemia cell lines, HL60 (promyelocytic leukemia) and K562 (chronic myelogenous leukemia), which were unseen during feature extractor pre-training. It was used to validate the generalizability of the feature extractor in classifying novel abnormal cell types. The third dataset comprised five types of normal leukocytes—BAS (basophil), EOS, LYM, MON, and NEU—as well as three types of abnormal leukemia cell lines: Jurkat (T-cell leukemia), HL60, and K562. This dataset included both all categories of normal cells and abnormal cell types (representing both lymphoid and myeloid lineages) not encountered during feature extractor pre-training.
Self-supervised pre-training
The self-supervised learning workflow in this study comprised two parts. First, a feature extractor was pre-trained using self-supervised learning on an extensive non-annotated dataset. Subsequently, for the three downstream differential tasks, the deep neural network for feature extraction was frozen, and only a lightweight classification head was trained separately on each annotated dataset. This approach thus enabled cell classification with minimal training cost while maintaining the integrity of the backbone feature extraction network.
Prior to being fed into the neural network, images were first resized to a fixed dimension of 224 × 224 pixels. During the contrastive pre-training phase, data augmentation was applied to generate different views; this step was omitted for downstream tasks. The images were then converted into PyTorch tensors, and pixel values were linearly scaled from the integer range [0, 255] to floating-point values [0.0, 1.0]. Finally, normalization was performed using Z-score standardization, with mean and standard deviation parameters set to 0.5 for all three channels. The training in this study was performed on Ubuntu 18.04 systems using PyTorch 1.8.2 and CUDA 11.1, hosted on AutoDL servers with an Intel Xeon Gold 6430 CPU (16 vCPUs) and a single NVIDIA RTX 4090 GPU (24 GB).
In the self-supervised pre-training phase, as illustrated in Fig. 1b, the MoCo v2 architecture36 was employed for contrastive learning, which featured a momentum encoder and a queue-based dictionary for maintaining a large set of negative samples. To formally define the learning objective, the instance discrimination pretext task was adopted. This task aims to learn an encoder such that the representation of a query image is similar to that of its positive key (a different augmented view of the same image) and dissimilar to representations of negative keys (other images in the queue). This is achieved by minimizing the InfoNCE (Noise-Contrastive Estimation) loss function, formulated as:
$${{\mathcal{L}}}_{\mathrm{InfoNCE}}=-\log \left(\frac{\exp \left({\boldsymbol{q}}\,\cdot \,{{\boldsymbol{k}}}_{{\boldsymbol{+}}}/\tau \right)}{{\sum }_{i=0}^{K}\exp \left({\boldsymbol{q}}\,\cdot \,{{\boldsymbol{k}}}_{{\boldsymbol{i}}}/\tau \right)}\right)$$
(1)
where \({\boldsymbol{q}}={f}_{q}({{\boldsymbol{q}}}_{\text{input}})\) and \({\boldsymbol{k}}={f}_{k}\left({{\boldsymbol{k}}}_{\text{input}}\right)\) denote the L2-normalized feature representations extracted by the query encoder fq and momentum encoder fk, respectively; k+ is the positive key feature; ki are negative keys sampled from the queue; K = 65536 specifies the queue size; and τ = 0.07 is a temperature hyperparameter that modulates the sharpness of the distribution. The parameters θk of the momentum encoder fk are updated via a momentum-based moving average of the parameters θq of the query encoder fq, following the update rule:
$${{\rm{\theta }}}_{k}\leftarrow m\cdot {{\rm{\theta }}}_{k}+\left(1-m\right)\cdot {{\rm{\theta }}}_{q}$$
(2)
with a momentum coefficient m = 0.999. This momentum-based update mechanism enhances the consistency of key representations across the queue.
Following the establishment of the theoretical framework, the implementation components were detailed in this section. The backbone feature extraction network was a ResNet-18 convolutional neural network, selected for its offers favorable balance between model complexity and accuracy, effectively meeting the feature extraction requirements for leukocyte images. Since the effectiveness of contrastive learning depended on the data augmentation strategy, a composite augmentation scheme—comprising rotation, flipping, erosion, and Gaussian blur—was designed to address the characteristics of non-annotated bright-field leukocyte images, which were single-channel and sensitive to magnification.
The batch size was set to 256, the maximum feasible on the RTX 4090 GPU (24 GB), to ensure high training speed. Key hyperparameters, including learning rates of 0.01 and 0.05, then intermediate values of 0.02 and 0.025, and finally 0.0225, were tuned to identify the optimal network for downstream feature extraction. The training performance of MoCo v2 was evaluated using two standard primary metrics: top-1 accuracy and contrastive loss36. Top-1 accuracy measures the model’s ability to correctly identify the positive key (augmented view of the same image) among a large number of negatives in the instance discrimination task and serves as a direct indicator of representation quality. Contrastive loss quantifies the similarity between positive pairs relative to negative pairs, with lower values indicating more effective learning of invariant features. These metrics offer complementary perspectives: accuracy reflects downstream discriminative potential, while loss guides the optimization process until convergence.
Multi-dataset downstream leukocyte differential
For the three downstream leukocyte differential tasks (Fig. 1c), two classification schemes were employed using the MoCo v2 pre-trained feature extractor, both evaluated with fivefold cross-validation: a linear classifier and a 3-layer multilayer perceptron (MLP). In both schemes, the feature extractor remained frozen, and the output logits o were converted into a probability distribution over the predicted classes via the softmax function, which is defined as:
$${\text{softmax}}{\left(o\right)}_{j}=\frac{{e}^{{o}_{j}}}{{\sum }_{k}{e}^{{o}_{k}}}$$
(3)
where oj denotes the j-th element of the logits vector o, corresponding to the raw, unnormalized score for the j-th class. The denominator \({\sum }_{k}{e}^{{o}_{k}}\) represents the sum of the exponentials of all elements in the logits vector, serving as the normalization factor that ensures the output values sum to 1. Thus, the function computes the probability of the j-th class by exponentiating its logit and scaling it by the sum of the exponentiated logits of all possible classes.
The linear classifier acted as a direct probe for the intrinsic discriminability of the features learned through self-supervised learning. It was defined by the transformation:
$$\hat{y}=\text{softmax}\left({W}^{{\rm{T}}}{\boldsymbol{z}}+b\right)$$
(4)
where the input feature vector \(z\in {{\mathbb{R}}}^{512}\) was projected directly to the output logits, introducing no non-linearity beyond the softmax function.
Furthermore, the MLP classifier introduced non-linearity through two hidden layers, sequentially transforming the input feature \({\boldsymbol{z}}\in {{\mathbb{R}}}^{512}\) to 1024 dimensions, then to 512 dimensions; each transformation was followed by non-linear activation and normalization operations before the final linear output layer produced the class logits o. This design allowed the MLP to enhance separability beyond a linear boundary while maintaining a lower computational cost relative to full-network fine-tuning, thus providing a practical balance for the downstream tasks.
To evaluate the effectiveness of the proposed scheme, this study also compared it against another self-supervised learning scheme and three supervised learning schemes on the three downstream tasks. All tasks used 5-fold cross-validation, and key hyperparameters such as the learning rate were tuned for optimal performance. A batch size of 256 was used across all tasks to maximize training throughput on the available GPU.
SimCLR was adopted as an alternative self-supervised learning framework for comparison. To facilitate a fair comparison of feature effectiveness between the two self-supervised methods, the SimCLR-trained feature extractor was similarly frozen, and an identical linear classification head was trained on the three downstream tasks. The SimCLR framework also utilized ResNet-18 as the backbone network with the same data augmentation as MoCo v2. However, since SimCLR’s performance is known to depend on a large batch size and lacks a momentum update mechanism, gradient accumulation was employed to overcome the memory limitations of a single RTX 4090 GPU (24 GB). An original batch size of 256 was combined with a gradient accumulation step of 16, yielding an effective batch size of 4096. Other key hyperparameters included a temperature of 0.5 and a learning rate of 0.1. For downstream evaluation, the linear classifier was trained identically to the MoCo v2 case, with the feature extractor frozen.
For comparison, we trained three supervised learning methods—MLP, ResNet-18, and ViT-Small—separately on the annotated dataset of each downstream task. Multilayer perceptron (MLP) is a feedforward artificial neural network model composed of an input layer, hidden layers, and an output layer, capable of learning complex patterns in data. By comparing the performance of a standalone supervised MLP with that of the self-supervised feature extractor followed by an MLP head, we could directly evaluate the effectiveness of the features learned through self-supervision.
ResNet-18 is an 18-layer deep residual network that mitigates the vanishing gradient problem through skip connections. As a lightweight architecture known for its balanced performance and parameter efficiency, it was selected as the supervised convolutional neural network benchmark for comparison with our proposed scheme.
Vision Transformer (ViT) is a transformer-based architecture for computer vision that divides images into fixed-size patches and treats them as token sequences for feature extraction. The ViT-Small variant was chosen for this study as the supervised ViT benchmark because its parameter count was comparable to that of ResNet-18, ensuring a fair comparison.
To compare the results from the three downstream tasks, classification accuracy, precision, recall, and F1-score were calculated for evaluation. Accuracy measures the proportion of correctly predicted samples. Precision measures the proportion of true positive samples among those predicted as positive. Recall measures the proportion of correctly predicted samples among all true positive samples. F1-score is the harmonic mean of precision and recall, thus providing a comprehensive assessment of model performance. In addition, Paired t tests were applied to evaluate the statistical significance of the observed performance differences between the self-supervised and supervised models across the datasets and metrics.
The core scheme of this study, the self-supervised framework based on MoCo v2, was further evaluated on the three downstream tasks using confusion matrices for both the linear and MLP classification heads. A confusion matrix visualizes the correspondence between predicted results and true samples in a tabular format, facilitating a detailed analysis of classification errors. Each cell contains the absolute count of instances and the corresponding proportion, which is calculated by is calculated by dividing the count in that cell by the total number of instances belonging to the true class of that row, thereby providing a normalized view of the prediction distribution for each actual class. Furthermore, Grad-CAM visualizations were employed to assess the interpretability of the learned representations, identifying the key morphological features that contributed to the classification decisions.


