The automated, machine learning-powered predictive approach enabled ExxonMobil to increase average production by more than 5% at Bakken gas lift wells optimized using this method.
Traditional ways of solving the question of how much gas to use for gas lift in the Bakken have drawbacks, ExxonMobil data scientist Sasha “Sha” Miao told an audience at the Unconventional Resources Technology Conference (URTeC) in Houston on June 18.

“The million-dollar question is, how much gas should we inject to produce the maximum amount of oil over the life of the well,” she asked. “More is not always better.”
Traditional methods for determining the optimal amount of gas to inject rely on physics and data-driven models, both of which have drawbacks, she said. Physics-based models typically provide robust results, but they are labor-intensive and expensive to calibrate, computationally expensive, and difficult to scale from a few wells to hundreds of wells. Moreover, such models rely on assumptions that may not hold true for unconventional wells, she noted.
Data-driven models, on the other hand, are easy to deploy across a field, but suffer from the fact that the asset in question is sparsely instrumented and the highly corrosive downhole environment means there are no downhole gauges to provide the data needed to feed the model.
A complicating factor is that Bakken wells employ pad compression, which limits the scope for modification, she added.
“The Bakken gets very cold in the winter,” she said, and changing the injection rate could cause compressor reliability issues.
We introduce a three-part automated data-driven workflow based on historical production data: Machine Learning-Based Gas Lift Optimization Workflow for Unconventional Fields (paper URTeC 4033553) details the machine learning (ML) prediction, Bayesian optimization, and deployment stages of the workflow, which is deployed through the cloud.
ExxonMobil piloted the workflow in 30 wells across eight Bakken well pads, achieving an average production improvement of more than 5%, and then deployed it to more than 200 gas lift and plunger-assisted gas lift wells in the Bakken.
“We forecast production from every well every week,” she said.
Make predictions
To build the ML predictive model, ExxonMobil collected historical daily data, including production rates, gas injection rates and surface pressure data, cleaned the dataset and plotted the total liquids production from all pilot wells. (Figure 1).

Miao said production forecasts are like stock price forecasts: Just as tomorrow's stock prices are highly correlated with today's stock prices, “next week's production is highly correlated with this week's production rate,” she said.
ExxonMobil transformed the time-series forecasting problem into a regression problem to determine which factors most affected production, she said. As expected, temporal features such as historical liquids production and changes in surface pressure and temperature were the most important factors in tuning the ML model, while gas injection rates were “somewhat important” and static well characteristics were the least important, she said.
After running the model on the well, it was time to do a sanity check to ensure the predictions matched the engineering experience. Predictions should evolve gradually, rather than change dramatically from week to week. (Figure 2).
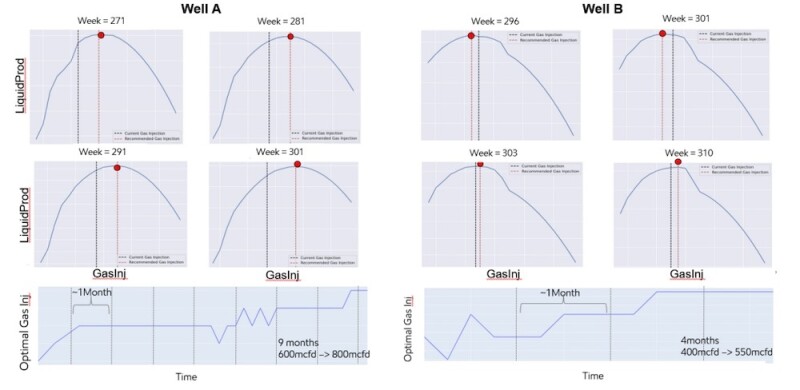
Source: Paper URTeC 4033553
Massive optimization
Optimizing gas lift in the pilot was not easy because Bakken wells operate on pad compression and each compressor has its own maximum and minimum required capacity. The goal was to maximize the total production of all wells sharing the same compressor while keeping the total gas injection rate of all wells sharing the same compressor within the compressor's capacity.
ExxonMobil chose the Bayesian optimization approach because of the scale of the problem and the efficiency of the method in dealing with a large number of wells, she said.
Deployment Architecture
The continuous integration/continuous deployment workflow used across the cloud includes a prediction pipeline and a training pipeline. (Figure 3) Miao said.
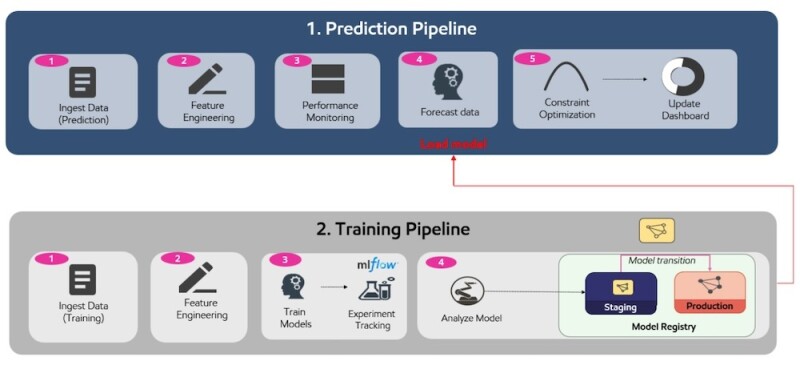
Source: Paper URTeC 4033553
“This prediction pipeline runs on a weekly schedule,” she said, while the training pipeline runs on a monthly basis.
The predictive pipeline forecasts well gas lift performance curves and solves for optimal gas injection rates subject to constraints. End users can compare predictions with actual measurements and alert and troubleshoot any significant deviations.
Every month, the training pipeline retrains the ML model on the latest data and compares it to the existing model – if the new model performs better, it will be used, otherwise the old model will be considered up-to-date and will continue to run for the next month.
“We need to make sure our models are up to date,” she said.
From pilot to expansion
ExxonMobil began the pilot in March 2023 on about 30 wells on eight different pads in the Bakken, which increased production by an average of 5%, she said. It was then fully rolled out and deployed to more than 200 gas lift and plunger-assisted gas lift wells in the Bakken. More than 50 wells were optimized at least once, and 84% of the wells were near optimal, increasing production by an average of 7%, she said.
This approach has completely replaced the physics-based approach in the Bakken, she said.
Miao said the pilot and expansion demonstrated the effectiveness of an automated, data-driven workflow for gas lift optimization in unconventional resources using machine learning.
“It's easy to scale and an effective, economical solution for cost- and equipment-constrained assets,” she says. “This workflow has become a daily monitoring and optimization tool for Bakken engineers to increase productivity and efficiency.”