
Characteristics of the study population
Table 1 shows the general characteristics of participants with and without diabetic retinopathy in this study. A total of 1,042 American adults were included, of which 212 were diagnosed with DR and 830 were diagnosed with non-DR. The mean age of the entire population was approximately 62 years. Women made up 53% of the participants, slightly more than men (47%). Non-Hispanic whites (40%), married (61%), those with a high school education or higher (60%), never smokers (52%), ever alcohol users (34%), those with a history of hypertension (75%) and hyperlipidemia (88%), and those with a PIR ≥ 1.00 (78%) made up the largest proportion of the entire population. Smoking status, urinary creatinine (-87.5 vs 103), and mean concentrations of heavy metals such as Sb (-7.30 vs -7.42), Tl (-6.71 vs -6.56), and Pt (-9.41 vs -9.58) were significantly different between DR and non-DR patients.
Correlation analysis and variable selection
Figure 1 shows the correlations between 13 heavy metals and the baseline characteristics of the population. The results show that most metals are correlated with each other to various degrees, with a relatively strong correlation between TI and Cs (r = 0.54), and a similar relationship between Co and Ba (r = 0.44). The curves based on the correlations between heavy metals and the baseline characteristics of the population and other details are shown in Figure S1. We also used the variance inflation factor (VIF) to assess the multicollinearity between all selected metals and covariates, and there was no multicollinearity.

Results of Pearson correlation analyses between metal factors and baseline variables.
Evaluation and comparison of 11 machine learning models
Figure 2 shows the effectiveness of the 11 machine learning models included to predict DR risk based on the test set, and the results of the training set are shown in Figure S2 as ROC analysis curves. The AUC value of the KNN model is 1.000, the AUC value of the GBM model is 0.991, the AUC value of the RF model is 0.988, the AUC value of the C5.0 model is 0.987, the AUC value of the NN model is 0.966, the AUC value of the XGBoost model is 0.961, the AUC value of the SVM model is 0.939, the AUC value of the MLP model is 0.911, the AUC value of the NB model is 0.831, the AUC value of the GP model is 0.800, and the AUC value of the LR model is 0.622. Table S1 and Table 2 show the performance metrics of the 11 models used in this study on the training and validation sets, respectively, and show the confusion matrices used by the 11 machine learning algorithms. The results show that among these machine learning models, the KNN model has the best predictive performance. As a result, the predictive model based on the KNN model was finally selected for subsequent analysis.

ROC of 11 machine learning models in the test set.
Interpretable Method Pipeline
Major metals among the important variables
The PFI analysis provided insight into the relative importance of all variables in the KNN model. The IML method was used to evaluate the contribution weights of the prediction model of heavy metal exposure (e.g., Ba, Cd, Co, Cs, Pb, Sb) and people's baseline characteristics (e.g., age, sex, BMI, education level, ethnicity, smoking and drinking status), which are shown in Figure 3A. The analysis showed that the first five variables (Sb, Ba, Pt, Ur, As) were relatively important variables in the prediction model. Among them, Sb level contributed a weight of 1.730632 ± 1.791722 in predicting DR risk, which was significantly higher than all other variables included. The important variables compared only with Sb level also included Ba, Pt, Ur, and As, which are relatively sensitive metals in predicting the onset of DR. The contribution weights of Ba, Pt, Ur, and As were 1.560474 ± 1.602271, 1.566063 ± 1.633790, 1.511366 ± 1.540538, and 1.456352 ± 1.496473, respectively. It is noteworthy that in our results, the contribution weights of demographic characteristics and lifestyle-related variables in predicting DR risk were lower compared with heavy metal exposure, and all baseline characteristic variables except age were weaker than heavy metal exposure.

Contribution of metal factors and baseline variables in the prediction model.a) Forest maps based on the PFI analysis show the corresponding contribution weights of heavy metals and baseline variables, as well as the corresponding standard deviations. (B) SHAP summary plot of all variables and DR risk. The width of the horizontal bar range can be interpreted as the influence on the model predictions; the wider the range, the greater the influence. The direction of the x-axis represents the likelihood of developing (right) or not developing (left) DR. (C) SHAP feature importance plots for heavy metals and DR risk. The magnitude of each feature's impact on the model output is measured by the average absolute value of the SHAP values of all samples, and they are ranked from top to bottom by the magnitude of their impact. D) SHAP summary plots for heavy metals and DR risk.
In addition, after screening the KNN model, we further verified the relationship between each variable and predicted DR risk by the SHAP method. The SHAP summary plot (Figure 3B) showed the overall impact of heavy metals and baseline variables on DR risk, ranked in descending order according to the importance of the features. In this case, a positive SHAP value indicates that the feature value is positively associated with DR risk, and the higher the value, the greater the contribution. The results showed that the top five important factors that could affect higher predicted DR risk were Sb, Pt, As, Tl, and Ba, in descending order. Moreover, in the two different analysis methods, Sb had a higher contribution weight to the prediction model than any other heavy metal or baseline variables, which is consistent with the results of the SHAP summary plot between heavy metals and predicted DR risk (Figure 3C, D).
Relationship between major metals and DR
The predictive performance of the selected KNN model was further illustrated by PDP analysis, in which the relationship between six major heavy metals (Sb, Ba, Pt, As, Tl, Cd) and the predicted value of DR is shown in Figure 4, and the results of the remaining heavy metals are shown in Figure S3. The results show that some heavy metals, including As, Co, Sb, and Tu, showed a significant trend that the predicted risk of DR increased with increasing levels of these heavy metals in the log-transformed interval of relatively high concentrations. The predicted risk of DR increased significantly with increasing log-transformed levels of some heavy metals, including As, Co, Sb, and Tu, in the log-transformed interval of relatively high concentrations, but there was no significant correlation between Pt and the predicted risk of DR at high concentrations. However, there was no significant correlation between the increasing or decreasing levels of Cs, Hg, and Pb and the DR risk. These results suggest that timely detection of major metal concentrations in living organisms may play an important role in predicting the onset of DR.

Relationships between major metals (a) Sb, (B) Ba, (C) Pt, (is) as, (picture) Tl, (debt) Cd versus predicted DR risk. The x-axis of the plots represents the log-transformed values of each metal.
Interaction effects of variables on DR
An analysis of the heavy metal exposure interaction characteristics with the PDPs model was conducted. The results in Figure 5A show that the corresponding variables with an overall interaction strength greater than 0.2 were Sb, age, Tu, Pt, As, Cd, and Ur, with Sb having the most significant interaction effect. The interaction performance of baseline variables in predicting DR risk remained weaker than that of heavy metals. Therefore, an interaction analysis of Sb with other variables was further conducted. Figure 5B revealed that the interaction of Sb with age was the highest among all metal pairs, with an overall interaction strength greater than 0.4. In addition to the strong synergistic effect of Sb with As, Tl, and Cs, ethnicity also had an effect on the prediction of DR risk with Sb, with an overall interaction strength greater than 0.2.
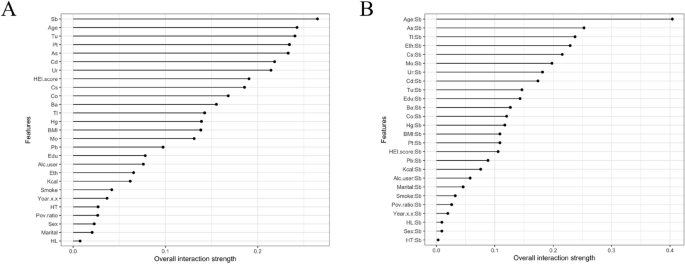
Interaction effect of variables on DR. (a) Interactions between heavy metals and baseline variables of DR. (B) Interactions between Sb levels and other variables in DR. The range of the lines represents the overall strength of the interactions; the wider the range, the stronger the effect.


