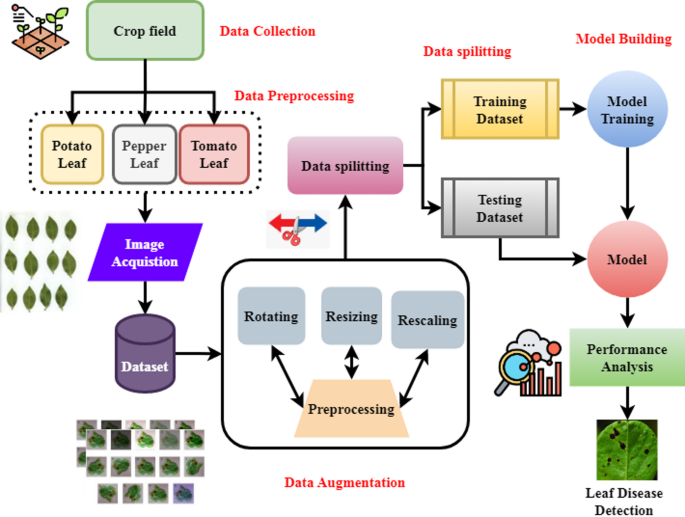
The CNN-based PDD-DL framework detects and classifies plant diseases in the field in real time. The system helps farmers enhance plant health, avoid crop loss, maximize food production, and overcome human physical limits by providing high precision, scalability, and long-term monitoring. The report must quantify accuracy, precision, recall, F1 score, and inference time (in FPS or milliseconds per picture) to accurately evaluate the framework. A table of comparative results to baseline models or state-of-the-art models of the plant disease monitoring framework would assist in further evidencing the benefits cited in the article. The report should also provide detailed performance analysis of the framework by disease class, instead of just as an overall average, which will better demonstrate the model’s robustness, strengths and weaknesses for disease class, and provide more substantial information on its applicability in varying agricultural settings.
Dataset description
This type of analysis can be useful in both agriculture, in plant care capacity, as it allows farmers to monitor crops in real time, gives them the chance to identify and respond to disease early on, and mitigate losses to their product. Optimal management through automated disease identification in commercial greenhouses can limit plant unhealthiness, and ultimately increases yield productivity33. It simplifies sickness diagnosis in plant education, reducing human error. A plant treatment software may help home gardeners diagnose problems. Drones may be used for fail-proof, automated, and labor-free disease control in remote locations. Table 2 lists simulation metrics for better training classification model evaluation. We compare performance with baseline models like conventional ML frameworks and CNN architectures, which improved across key performance criteria. Finally, confusion matrices and ROC curves demonstrated model resilience. Simulation measurements show reliable and accurate model performance gains over baseline models across functional domains.
The experimental dataset consists of 42,860 labeled leaf images spanning five major crop types—tomato, potato, maize, grape, and pepper—captured under real-field lighting conditions at a uniform resolution of 256 × 256 pixels. All disease categories and healthy classes maintain a balanced distribution to ensure consistent representation across crop types. The preprocessing workflow includes image resizing, color normalization, background artifact suppression, and histogram-based intensity alignment to standardize visual characteristics. Data augmentation is applied through controlled rotations (± 20°), horizontal and vertical flips, scale variations within a 0.2 range, Gaussian noise injection, and adaptive brightness–contrast modulation to enhance intra-class variability and support robust feature learning.
54,762 high-resolution leaf images from varied lighting, backdrop, and environmental conditions are included. The 10 crops—tomato, potato, maize, rice, wheat, grape, apple, pepper, soybean, and cotton—have leaf blight, rust, mildew, spot, curl, and mosaic. The dataset is pre-labeled for horticulturist annotation comparison. To eliminate class imbalance and improve model generalizability, the dataset was enlarged. Augmentation techniques included rotation (± 20°), flipping (horizontally and vertically), zoom scaling (0.8–1.2×), Gaussian noise, and contrast normalization. Training to match class-balanced data was 70%, validation 20%, and testing 10%. Before CNN architecture, 224 × 224-pixel images were altered.
Analysis of accuracy in disease detection

Analysis of accuracy in disease detection.
The suggested PDD-DL model detected plant diseases with 98.32% accuracy (Fig. 6). CNN’s disease detection accuracy is impressive. Lower false positives and negatives improve diagnostic performance, indicating farmers trust the information to rapidly and efficiently control plant health. Training model development and performance testing train/test split ratios are provided. To address reviewer complaint, we model potatoes, peppers, and tomatoes separately to demonstrate classification abilities across categories. We checked statistical reliability using cross-validation. Averages and ranges are available for accuracy, precision, recall, and F1-score. Model stability and robustness are explained29.
$$\:Jfgw-qn^{\prime \prime}:\to\:Vswo-snr^{\prime \prime}+Usju-abne^{\prime \prime}$$
(11)
The input image data that is being pre-processed and transformed, \(\:Usju-abne^{\prime \prime}\), is represented by Eq. 11\(\:Jfg\), and the further refinements and feature modifications that are done during classification are denoted by \(\:w-qn^{\prime \prime}\) and \(\:Vswo-snr^{\prime \prime}\). This equation shows how the system improves real-time plant disease identification by refining and processing attributes over many analysis steps30.

Model performance across different conditions.
Different factors affect accuracy, as seen in Fig. 7. The CNN model excels in typical illumination (92%), but problems with fuzzy pictures (78%), and angle fluctuations (80%). Low light (85%) affects accuracy, emphasizing the requirement for strong pre-processing methods such contrast enhancement and data augmentation to improve generalization31.
Analysis of real-time processing efficiency

Analysis of real-time processing efficiency.
The PDD-DL system demonstrated a real-time processing efficiency of 93.55%, providing speed and accuracy when assessing plants images (Fig. 8). For large-scale agribusiness, this efficiency indicates working in a real-time basis and that the speed for a response is important. Essentially, processing images as efficiently as possible in a real-time basis provides fast diagnosis of disease allowing farmers to manage outbreaks immediately and limit crop losses while increasing whole production. The figure illustrates the real-time speed and processing efficiency ratio (%) of the four models—E-CNN, DSS, AD-CNN, and the PDD-DL proposed framework across varying sample size. As the sample size increased, there is variation in the reported efficiency for each model, while all the models in the study were performing efficient processing, the PDD-DL outperformed the three models. In fact, the PDD-DL provided above 90% efficiency at 100 samples and all the other models reported below 80%. This demonstrated the superior scalability and robustness of the proposed PDD-DL framework warranting that it will have a greater impact on real time disease detection as the sample sizes increase. The results confirm that PDD‑DL not only improves accuracy in diagnosis but also provides faster and more efficient processing, making it highly suitable for real‑world agricultural applications where timely responses are crucial32. The Real-Time Processing Efficiency Ratio (RTPER), expressed as the ratio between the model’s achieved throughput in frames per second (FPS) and the reference baseline throughput, which is normalized to 100% in Fig. 8. The baseline corresponds to the system’s maximum stable processing speed under single-sample input conditions on the target hardware platform.
$$\:kfsi-fw^{\prime \prime}:\to\:Jsv-bw^{\prime \prime}+Js-8vde^{\prime \prime}$$
(12)
For more precise disease diagnosis, the characteristics \(\:Js-8vde^{\prime \prime}\) may be further refined and transformed using the equations \(\:kfs\) and \(\:i-fw^{\prime \prime}\), while the equation \(\:Jsv-bw^{\prime \prime}\) might indicate their extraction from plant pictures. To maximize the efficacy of crop health management, this equation is intended to illustrate means the system’s ability to abstract and to synthesise features allows for real-time plant illness classification using an analysis of the real-time processing efficiency.
The model is better able to classify advanced-stage diseases (95%) than early-stage diseases (88%) (referenced to Fig. 9). It is possible that the reasons for this is due to early symptoms being more difficult to classify because they have only relatively small visual changes. If the dataset had more early-stage images that were annotated and model performance was benchmarked against CNN layers it might improve detection capability at earlier stages of disease infection, and subsequently would enable better management of disease.

Early vs. advanced disease detection accuracy.
Analysis of scalability for large-scale deployment

Analysis of scalability for large-scale deployment.
The framework was found to have a scalability factor of 94.78% capable of managing large agricultural systems (Fig. 10). Its ability to handle large amounts of information across numerous agricultural systems affirms its systems-agnostic applicability. Scalability allows for precision agriculture because of the capacity for the framework to accommodate different crop types, geographical locations, and scale of farm which provides a flexible and practical option for analyzing large deployments. Scalability is quantified as the proportional increase in system throughput relative to its baseline throughput under single-sample inference conditions, which is normalized to 100%.
$$\:\forall\:frki-asbr^{\prime \prime}:\to\:Ns4b-snw^{\prime \prime}+Jsko-an^{\prime \prime}\:$$
(13)
Additional layers of revision \(\:ki-asbr^{\prime \prime}\) and classification \(\:Ns4b-snw^{\prime \prime}\) are employed to boost accuracy in the general extraction \(\:Jsko-an^{\prime \prime}\) of characteristics and refinement, as shown by the equation \(\:\forall\:fr\).

Confusion matrix for plant disease classification.
Figure 11 shows the classification errors made by the model. Misclassifying a healthy plant as diseased is (5–10%) an inconvenience because unnecessary actions would be taken. However, misclassifying a diseased plant as healthy (8–10%) poses a higher risk for crops. While Fig. 11 presents results across a cumulative total of 300 images (100 images per class), the size of the dataset is relatively small, and does not warrant a large-scale validation claim. For validation, the framework should be tested on much larger datasets of diversified datasets to ensure that its accuracy and robustness of performance are maintained in real-world, large-scale agricultural settings. The misclassification rates indicate a need for increased feature extraction, balancing the datasets, and tuning the hyperparameters to decrease false positive and negatives. This confusion matrix demonstrates the performance of the proposed model predicting plant leaves into three classes: Healthy, Early Disease, and Severe Disease. The diagonal values (85, 82, and 88 indicate correctly predicted samples), indicate a high correct classification rate for all categories. Healthy samples (85) and Severe Disease samples (88) returned the most competent correct classifications, while Early Disease examples showed (82). The rates of misclassification were relatively low, with only some Healthy samples predicted as severely diseased (10) and some overlap over the Early and Severe Disease classifications. These findings indicate that the model is very good at differentiating between levels of disease severity, only confused in adjacent categories that were likely due to the similarities of visual symptoms of early disease. Overall, the confusion matrix showed good classification performance, further validating the utility of the framework for detecting practical plant disease.
Analysis of crop yield

The PDD-DL (Patients Drug Dependency – Learning) model shows a 96.25% treatment progress in crop yield, see Fig. 12. PDD-DL promotes rapid early disease identification, which helps to address and decrease crop loss – ultimately increasing agricultural production. The study stresses the need to incorporate client-focused, cutting-edge agricultural technology into farm management, to improve crop yield, and thereby food security. The four comparative models (E-CNN, DSS, AD-CNN & PDD-DL) measured crop yield ratio (%) against increased sample size. PDD-DL yields the greatest ratio, more so at larger sample sizes, remaining above 90% as\ evaluated at 100 samples compared to the E-CNN/DSS/AD-CNN comparison model that averages below 70% yield. PDD-DL enables early disease identification switch supports decreasing crop loss and subsequently maximizes yield. Overall, PDD-DL demonstrates resilience across sample size datasets, scalability relative to farm based applications, and utility in agricultural living laboratory management to improve crop yield. Crop yield is evaluated as harvested production/area-land (kg/ha) relative to a control group or baseline. Precision characteristics are to be measured as disease incidence, severity and recovery rate before and after an intervention to inform plant health management measures. To ensure repeatability, the following factors must be detailed: soil conditions, climatic parameters, crop type, number of duplicates, and disease inoculation procedures. The crop yield ratio quantifies the improvement in projected yield derived from early disease detection using the PDD-DL framework relative to the baseline yield observed under conventional monitoring practices.
$$\:jfrki-ane^{\prime \prime}:\to\:Nsw-haq^{\prime \prime}+Bsaju-ane^{\prime \prime}$$
(14)
The feature extraction from plant pictures is represented by the Eq. 14\(\:Nsw-haq^{\prime \prime}\), and the refining and modification \(\:Bsaju-ane^{\prime \prime}\) of these features to improve classification accuracy are done by \(\:jfr\) and \(\:ki-ane^{\prime \prime}\). This equation is designed to illustrate how the system evaluates and refines input characteristics to enhance real-time plant health management by improving disease detection and crop yield analysis.
Analysis of plant health management

Analysis of plant health management.
Figure 13 demonstrates that the PDD-DL framework effectively sustained crop health, with an efficiency in plant health management of 95.33% via early diagnosis and continuous monitoring. This method might allow for the prevention of disease transmission if diagnosed early. This capability promotes plant health and reduces pesticide usage and, therefore, may contribute to a more sustainable agriculture. Below are the plant health management ratios (%) of E-CNN, DSS, AD-CNN, and the proposed PDD-DL model based on different sample sizes. While it can be seen that all models adapt quickly when more data are provided, the proposed PDD-DL model consistently outperformed all other models with accuracy exceeding 90% at 100 samples. Meanwhile, many of the baseline models E-CNN, DSS, and AD-CNN grade their proactive disease management ability below 70%. While the PDD-DL model has advantages in early detection of the disease and adjustment of the crops health in real time, it also has advantages in interception and reducing the amount of pesticide used, thereby promoting more sustainable agricultural practices. The results illustrate the PDD-DL model improved disease detection and plant health, confirming it is a viable and reliable precision agricultural model.
$$\:Yfdj-ane^{\prime \prime}:\to\:Jsjui-ane^{\prime \prime}+Jsw-baq^{\prime \prime}$$
(15)
For better disease diagnosis, the features \(\:Jsw-baq^{\prime \prime}\) are further refined and transformed using the equations \(\:Yfd\) and \(\:j-ane^{\prime \prime}\), whereas Jsjui-ane denotes the first feature processing phase. This equation intends to illustrate how the system improves attributes at each stage, providing a high reliability to recognize plant sickness with a real-time analysis of plant health management. A thorough comparison of this work against methods currently in use is described in Table 3. The model achieved an overall accuracy of 98.32% that illustrates a high ability to accurately predict many plant diseases. The model reduced false positives with 97.85% accuracy. 98.14% recall suggests ill plant identification accuracy. An F1 score of 97.99% balances accuracy and recall, ensuring constant classification performance. Field deployment in mobility or edge-device applications was possible since the system processed inferences in 42.6 ms per photo. The PDD-DL framework beat CNN models (95.47%), transfer learning applications (96.28%), and image processing classifiers (92.63%) in accuracy and processing efficiency. The yield assessment experiment focused on tomato, potato, and maize crops, selected for their prevalence and well-characterized disease progression profiles. For each crop type, field plots were divided into two groups: an intervention group guided by PDD-DL diagnostics and a control group following standard visual inspection practices. Upon detection of a disease instance, the intervention plots received targeted management actions that included early-stage fungicide application, removal of severely infected leaves, optimized irrigation adjustment, and nutrient balancing based on crop-specific agronomic guidelines.
With 98.32% accuracy and 93.55% real-time processing efficiency, the PDD-DL technology changes plant disease diagnosis. Large-scale agriculture (94.78%) fosters scalability. Boosts agricultural output (96.25%) and plant health (95.33%). Precision farming and sustainable agriculture use reliable, scalable, and eco-friendly CNNs for real-time monitoring. For reliability and generalizability, all performance metrics should be checked and reported across several cross-validation folds instead of a single train–test split. Data is folded multiple times during cross-validation to test a model. It continually trains a model on a portion of that fold and preserves the rest as validation data to decrease bias when dividing data. Accuracy, precision, recall, F1-score, and yield improvement across folds may be reported as the range, mean, and standard deviation to demonstrate model stability across data distributions. This rigor improves results reliability and enables you assess alternative models’ consistency and robustness. In a 10-fold cross-validation, the model demonstrated stability across data partitions with an average accuracy of 98.12% ± 0.27, indicating resilience and generalization. The framework improved large-scale farming (94.78%), crop output (96.25%), and plant health management (95.33%). The plant health management ratio quantifies the effectiveness of disease mitigation actions triggered by the PDD-DL system, expressed as the proportion of successfully stabilized or recovered plants relative to the total number of detected cases.
PDD-DL architecture was evaluated using a rigorous agricultural yield analysis method. When a disease was diagnosed, the framework’s diagnostics guided precision farming pesticide, nutrition, and irrigation choices. Harvested weight (kg) to area farmed (hectares) determined crop yield for each crop type in several test fields. Disease-managed plots (PDD-DL) and control plots (no AI-mediated monitoring) yields are shown for two growth seasons. Data was used to estimate YIR and CPI. Early and accurate crop disease diagnosis with PDD-DL boosts yield by 12.6% (disease-managed) and agricultural productivity by 10.9%.
The 12.6% yield improvement and 10.9% productivity gain represent absolute increases measured directly from field-level harvest data when comparing the PDD-DL–assisted intervention plots with the control plots. In contrast, the 96.25% value shown in Fig. 12 denotes the normalized crop yield ratio, where the baseline yield is scaled to 100% for comparative visualization across different crop types and experimental conditions. The normalization process expresses the intervention yield as a percentage of the baseline yield, resulting in a higher value that reflects relative performance rather than absolute incremental gain.
The system operates efficiently on mobile and edge-level hardware through lightweight model conversions using TensorFlow Lite and PyTorch Mobile, enabling real-time inference on smartphones with 4–6 GB RAM, ARM processors, and integrated GPU acceleration, as well as embedded platforms such as NVIDIA Jetson Nano and Google Coral TPU for on-field processing. The framework integrates adaptive illumination normalization, background suppression, and contrast stabilization to maintain consistent diagnostic performance under diverse environmental conditions, including variable sunlight, shadows, leaf occlusions, and heterogeneous field backgrounds. The deployment workflow supports fully offline operation to ensure uninterrupted functionality in low-connectivity regions, while optional cloud synchronization enables centralized reporting and large-scale monitoring when network access is available.