High-level optimization summary
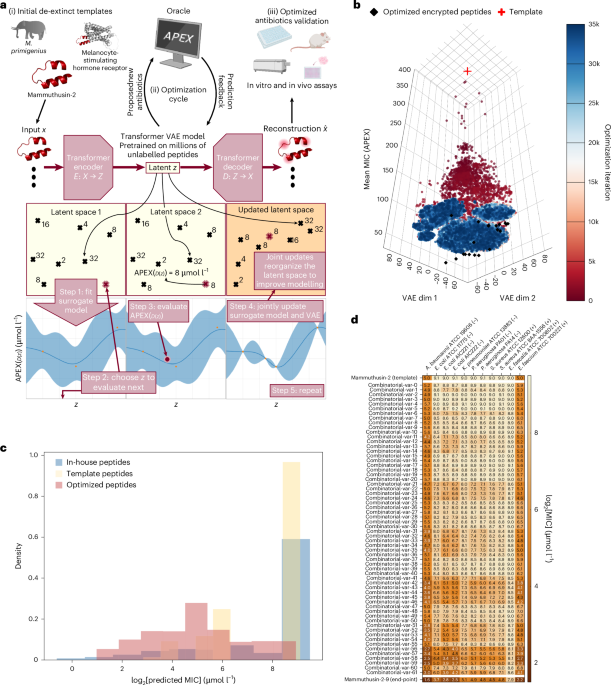
We include here a high-level summary of our optimizer and architecture, the exact details of which we provide below. ApexGO consists of three components. The first component is a generative model that can produce peptides. We train our generative model broadly over large sets of protein and peptide space drawn from UniProt to be capable of producing arbitrary, even non-AMPs. The second component is an oracle—in our case, the APEX model described below—that predicts the MIC (in μmol l−1) of any input peptide against 11 different bacterial pathogens. Finally, we use an optimization algorithm—particularly, we develop a BO approach that extends recent work in this area—to induce the generative model to produce peptides that APEX will score highly. The resulting peptides we find that APEX predicts have low MIC are the ‘optimized’ peptides that we characterize experimentally.
APEX 1.1
APEX8 is a deep learning-based model that takes peptide sequences as inputs and predicts MIC against A. baumannii ATCC 19606, E. coli ATCC 11775, E. coli AIC221, E. coli AIC222, K. pneumoniae ATCC 13883, P. aeruginosa PAO1, P. aeruginosa PA14, S. aureus ATCC 12600, methicillin-resistant S. aureus ATCC BAA-1556, vancomycin-resistant E. faecalis ATCC 700802 and vancomycin-resistant E. faecium ATCC 700221. APEX 1.1 (ref. 39) used a hybrid of recurrent and attention neural networks to extract peptide-level features that are useful for antimicrobial prediction from physicochemical and biomedical properties of amino acid sequences and was jointly trained by publicly available AMPs10,11,12 and our internal peptide antimicrobial activity data. Through wet-laboratory experimental validation, we demonstrated the reliability of APEX 1.1 on finding AMPs. In the ApexGO framework, APEX 1.1 serves as the oracle function and provides the MICs of peptides to guide the BO to propose peptide sequences with improved antimicrobial activities. For the rest of the Article, we refer to this oracle as APEX.
Black-box BO
In black-box optimization, we aim to optimize an oracle objective function \(f\left(x\right)\) over a space of candidates \({x}^{* }={\text{argmax}}_{x\in {\mathcal{X}}}f\left(x\right)\). Examples of such problems include maximizing the binding affinity of small molecules19,40 or proteins41,42. Commonly, \(f\left(x\right)\) is assumed to be expensive to evaluate and accessible only through evaluation, that is, the underlying behaviour of the objective is unknown.
BO is a sample-efficient model-based framework to solve these costly to evaluate optimization problems43,44,45. At iteration \({t}\) of BO, one has access to observations \({D}_{t}={\left\{\left[{x}_{i},{y}_{i}\,\right]\right\}}_{i=1}^{t}\), where \({y}_{i}\) denotes the (possibly noisy) objective value of the input \({x}_{i}\). Typically, a Gaussian process46 or approximate Gaussian process23,47 is used as the surrogate model to approximate the objective function using these inputs and values. This surrogate model aids the optimization by using an acquisition function, which utilizes the surrogate model’s understanding of the objective to strategically propose the next candidates for evaluation. After querying these candidates through the true oracle, the surrogate model is updated with the observations. This process gradually builds a more comprehensive dataset and refines the surrogate model, thereby improving the quality of the proposed samples in future iterations.
BO over latent spaces
Due to the discrete and structural nature of peptide sequences, we utilize recent developments in latent space BO that adapt BO from continuous black-box optimization problems to the discrete domain48,49. Latent space BO leverages the capabilities of deep generative models, most commonly VAEs21 to aid optimization. Concretely, a VAE is composed of two networks: an encoder E(z|x):X→P(Z) mapping from amino acid sequences to a latent space \(Z\), and a decoder D(x|z):Z→P(X) that probabilistically decodes latent space vectors back into amino acid sequences X. The VAE is trained in a self-supervised fashion on a large set of unlabelled amino acid sequences using the following standard VAE loss:
$${{\mathcal{L}}}_{\mathrm{VAE}}={{\mathbb{E}}}_{{\mathcal{E}}\left(Z,|,X\right)}\left[\log [D\left(X,|,Z\right)]\right]-\beta {KL}{\mathscr{(}}{\mathcal{E}}\left(Z,|,X\right)\mathrm{||}p(Z)).$$
The first term encourages reconstruction accuracy (the amino acid sequences we pass into the encoder being the same as the one we get out of the decoder), and the second Kullback–Leibler divergence term encourages smoothness of the latent space by regularizing the encoder towards the prior distribution \(p(Z)\triangleq {\mathscr{N}}(0,{\bf{I}})\). In this work, we train a six-layer transformer encoder and decoder VAE that bottlenecks down to two tokens with 128 latent dimensions each, for a total of 256 latent dimensions. We train with a Kullback–Leibler regularization factor of \(\beta ={10}^{-4}\).
Sequences are tokenized as 1-mers (k = 1) using a vocabulary of the 20 standard amino acids plus special tokens
After the VAE is pretrained on a large number of peptide sequences, for example, all sequences in UniRef50 within a certain size range, we can define our search over the continuous latent space Z of the VAE instead of the discrete space of amino acid sequences X, we can now formulate our optimization problem as
$${x}^{\star }{\mathscr{\approx }}{\mathcal{D}}\left({z}^{\star }\right),\,\mathrm{where}\,{x}^{\star }={\mathrm{argmax}}_{z{\mathscr{\in }}{\mathcal{Z}}}f\,{\prime} (D(z)).$$
The objective function we are optimizing now takes in a latent vector \(z\) and decodes it into an amino acid sequence, which is then evaluated on our black-box objective function f. Because the true objective function (that is, MIC) requires expensive laboratory synthesis to evaluate, we run optimization using our APEX model f′, which estimates the true MIC of the amino acid sequence. After running optimization to obtain sequences that achieve low MICs according to APEX, we then select a batch of the best-performing sequences that are then sent to the laboratory for synthesis and experimental validation. Our optimization algorithm is based on our prior work, the LOL-BO algorithm19, which we adapt here for the constrained template derivative optimization setting.
Before beginning optimization, we pretrained a VAE model on unlabelled amino acid sequences. We train a VAE on 4.5 million amino acid sequences of less than 50 amino acids in length, randomly cropped from the UniRef database50 for 118 epochs on a single NVIDIA RTX A6000 GPU to obtain a final test-set reconstruction accuracy of 99.94%. We reused this same initial pretrained VAE for all optimization returns, with some additional unlabelled fine tuning, as described below.
We then ran BO in the latent space of the VAE model to find amino acid sequences that minimize \(f\,{\prime} \,(D(z))\), where \(f\,{\prime}\) was the estimated MIC of the amino acid sequence according to our APEX model. We use a parametric Gaussian process regressor surrogate with 1,024 inducing points to model the data collected during optimization23, and select the best candidate latent space point \(z\) to evaluate next on each iteration of optimization using Thompson sampling to perform acquisition.
Following the LOL-BO algorithm19, we also periodically update our VAE model jointly and in an end-to-end fashion with the GP surrogate model to encourage the VAE latent space to reorganize such that peptides with similar scores (MICs) are moved closer together and the space becomes more ideal for modelling and optimization. The models are updated jointly using the following loss:
$${{\mathcal{L}}}_{\mathrm{joint}}={{\mathbb{E}}}_{{\mathcal{E}}{\mathscr{(}}{Z|X})}\left[{{\mathcal{L}}}_{\mathrm{PPGPR}}\left(y,\,Z\right)\right]+{{\mathcal{L}}}_{\mathrm{VAE}}(X).$$
Here the first term is an expectation over the encoder of the typical36 parametric Gaussian process regressor loss \({{\mathcal{L}}}_{\mathrm{PPGPR}}(y,Z)\), and \({{\mathcal{L}}}_{\mathrm{VAE}}\) is the VAE loss described above.
Using trust regions
In addition to the joint model updates19, it was shown that latent space optimization can be improved by using trust region optimization to limit over-exploration in the very high-dimensional latent search space. We, therefore, use trust region BO24. This method works by defining a hyper-rectangular trust region within the search space, and limits the search for candidates to this local region. The trust region is always defined to be centred on the best point observed so far (the latent space point that achieved the best score \(y=f\,{\prime} (D(z))\) we have seen so far), and the size of the trust region is adapted on each iteration depending on the recent success of the optimizer, with the initial trust region width set to 0.8. If we fail to make progress (to find a latent point z that achieves a better score than the best we have seen so far) for 32 consecutive optimization iterations, the length of the trust region is reduced by a factor of two to further limit overexploitation. Conversely, when we do make progress for ten consecutive iterations, the length of the trust region doubles to allow more exploration.
Adding constraints
A strong desideratum when optimizing each template peptide was to maintain high similarity to the initial template, we choose this similarity constraint because we want to obtain the derivatives of peptides that were previously validated, that is, similarity of >75%. We, therefore, optimize under an added constraint that all amino acid sequences proposed by the optimization algorithm must be at least 75% similar to the template sequence. Similarity here is measured as \((l-d)/l\), where \(l\) is the length of the seed peptide and \(d\) is the Levenshtein distance between the proposed peptide and the seed.
To add this constraint, we adapted the scalable constrained BO algorithm51 to the latent space/generative BO setting. This algorithm works by training a second GP surrogate to model the constraint function \(C(D(z))\). In our case, C(D(z)) is the similarity of the proposed peptide D(z) to the template sequence, as measured by the fraction of sequence overlap. During optimization, we require that C(D(z)) ≥ 75% for all generated candidates z proposed by the optimizer. On each iteration of optimization, when we use Thompson sampling to select a candidate point z to evaluate next, we exclude all sampled zs for which the constraint GP model predicts that the sample will be infeasible (that is, C(D(zs)) < 75%). Then, for each remaining candidate latent vector z, we evaluate the true constraint function C(D(z)) and update the constraint GP.
Fine-tuned VAEs for template optimization
Different from the setting considered in the original LOL-BO, we seek to specifically produce optimized derivatives of pre-existing templates. However, VAEs trained on global sets of proteins will devote only small regions of the latent space to producing sequences with high similarity to any particular template: in other words, most sequences produced by the generative model a priori would look nothing like the template. To bias decoding towards a given template and maintain sequence closeness, we generate 20,000 synthetic derivatives by random mutagenesis within the similarity constraint used downstream (≥75% identity by edit distance to the template). We then continue training the pretrained VAE on this per-template derivative set using the same optimizer, learning rate (2 × 10⁻⁴), batch size (512), dropout (0.05), β (1 × 10⁻⁴) and model dimensions as in pretraining. This increases the rate at which the VAE produces candidates that satisfy the hard similarity constraint imposed during BO, without changing the APEX-guided objective. The mutation generator and fine-tuning scripts are available in our GitHub repository (see the code availability statement) to support full reproducibility. This has the effect of notably increasing the rate at which the VAE produces sequences similar to the template. Although the generated sequences will not initially improve antimicrobial activity, this improves gradually over the course of optimization because we update the VAE jointly with the surrogate model.
Using multiple trust regions to optimize a set of multiple sequences
Rather than finding a single amino acid sequence that achieves low MIC according to the APEX model, what we want to do is find a set of unique amino acid sequences that all achieve low MIC according to APEX. Having a set of different sequences is important because it increases the chance that some of them will achieve success when they are sent to the wet laboratory for validation. Thus, rather than searching for a single optimal amino acid sequence, we simultaneously optimize a set of M = 20 unique amino acid sequences. To accomplish this, we follow ROBOT20 in using 20 different trust regions centred on the 20 unique best-scoring points found so far. Each trust region is responsible for finding one of the 20 final unique sequences in our final set of optimal sequences. On each step of optimization, we select candidate points from within each of the 20 trust regions. In the ith trust region, we discard and resample candidates that are insufficiently diverse from the candidates chosen by trust regions j < i according to our chosen diversity metric. Specifically, in ApexGO, we discard candidates from the ith trust region if any early trust region has already proposed that candidate exactly. We update the size of each trust region according to that individual trust region’s success or failure to propose a sequence that improves on the best-scoring sequence in that trust region. The 20 trust regions use a shared data history and are recentred after each iteration so that they are always centred on the best 20 unique sequences observed so far. At the end of the optimization, our final set of optimized sequences are the final centres of the 20 trust regions.
Optimization goal and setup
During optimization, we aim to produce peptides that achieve low average predicted MIC according to the APEX 1.1 model. We perform separate optimization runs against two objectives: (1) the average predicted MIC against Gram-negative bacteria only (that is, A. baumannii ATCC 19606, E. coli ATCC 11775, E. coli AIC221, E. coli AIC222, K. pneumoniae ATCC 13883, P. aeruginosa PAO1 and P. aeruginosa PA14), and (2) against both Gram-negative and Gram-positive bacteria (that is, A. baumannii ATCC 19606, E. coli ATCC 11775, E. coli AIC221, E. coli AIC222, K. pneumoniae ATCC 13883, P. aeruginosa PAO1, P. aeruginosa PA14, S. aureus ATCC 12600, methicillin-resistant S. aureus ATCC BAA-1556, vancomycin-resistant E. faecalis ATCC 700802 and vancomycin-resistant E. faecium ATCC 700221). In both cases, the BO minimized the objectives (that is, lower MICs corresponds to higher antimicrobial activities). In addition to the minimization objective, we used a similarity constraint in which each generated peptide should be at most \(25 \%\) different to given template, where difference is measured as \(\frac{{\rm{distance}}}{{l}_{{\rm{template}}}}\). We used a batch size of 50 for optimization, with 20 trust regions and τ = 1, meaning that we aim to produce 20 different peptides for the same template in a single optimization run. We update our surrogate model and VAE jointly every ten steps of optimization and initialize the optimization with 10,000 peptides randomly mutated from the template peptide.
Enumeration of mammuthusin-3 and arctoterin-1
Two of our parent template peptides, mammuthsin-3 (10 residues long) and arctoterin-1 (15 residues long), are sufficiently short such that under our similarity constraint of 75% by edit distance, it is feasible to enumerate and score all the possible derivative peptides using the APEX oracle. This comprehensive approach allowed us to directly compare ApexGO with the highest-scoring derivative peptides. In particular, for both templates, ApexGO recovered all 20 of the top-20 enumerated peptides, indicating that the derivatives validated in this study were globally optimal according to the APEX oracle. This result highlights the strength of our optimizer, as ApexGO successfully identified the best possible peptides (according to APEX) in both settings in which it was computationally feasible to verify this. This result highlights the strength of our optimizer: whenever the search space can be fully enumerated, ApexGO still lands on every global optimum. By contrast, a 20-residue template that permits up to five single-site edits (substitution, insertion or deletion) already spans ~3 × 10¹² unique sequences; even screening a million designs per minute would take more than 1,000 years to exhaust that space. Because exhaustive search is infeasible for many realistic peptide design tasks, the utility of ApexGO lies in its ability to rapidly discover multilog improvements within a realistic experimental budget—demonstrated here by its perfect recovery of all top-ranked variants for short templates and, for longer peptides, by routinely achieving 8–16-fold gains in MICs and avoiding impractical brute-force evaluation.
Benchmark against existing BO frameworks
To further highlight our approach, we benchmarked ApexGO against state-of-the-art generative BO approaches from the literature. In Supplementary Fig. 11, we compare ApexGO directly with (1) the LOL-BO implementation19 and (2) a standard latent space BO pipeline, adapted with the high-dimensional trust region heuristics51. To ensure fair comparison, all methods were evaluated using the same peptide VAE with fixed weights. For each method, we optimized all ten template peptides and plotted the APEX-predicted MIC of the best peptide returned by each run (ten data points per method; Supplementary Fig. 12). ApexGO outperforms both baselines across all ten templates: the worst-performing ApexGO run matches the best run of standard BO, and LOL-BO is consistently outperformed by ApexGO despite using a comparable closed-loop framework. These results confirm that ApexGO’s joint VAE-retraining, multiple-trust-region strategy delivers state-of-the-art performance in peptide design.
Benchmark against HydrAMP and PepDiffusion
To compare ApexGO against contemporary deep generative AMP models, we evaluated HydrAMP16 and the PepDiffusion17 latent diffusion model for derivative generation using the same ten extinct template AMPs that serve as seeds for ApexGO in the main experiments.
We used the official HydrAMP implementation and the publicly released generator and decomposer weights. For each seed sequence, we called the analogue_generation routine under the discovery filtering criterion with decoder temperature \(T\in \{\mathrm{3,5,10}\}\), using batches of 256 attempts and a fixed proposal budget of at most 1,000,000 total candidates and 200,000 unique sequences per seed. HydrAMP proposes derivatives without the explicit knowledge of our similarity constraint; therefore, after generation, we computed the Levenshtein distance between each candidate and the corresponding seed and retained only those with similarity of ≥75%, defined as \(1-\,\frac{{\rm{distance}}}{{l}_{{\rm{template}}}}\). The surviving derivatives were scored with the same APEX Gram-negative objective used by ApexGO (lower values indicate better predicted activity). For each seed and temperature, we then selected the top-K feasible sequences, where K equals the number of ApexGO designs produced for that seed, and compared their objective values with ApexGO’s top-K set (Supplementary Fig. 1).
To evaluate panel-level robustness, we calculated per-organism predicted MIC distributions across all seven Gram-negative targets. Here 84.9% of ApexGO’s designs improved predicted MIC relative to the seed across all seven Gram-negative organisms, compared with 50.3%, 55.7% and 32.9% for HydrAMP at decoder temperatures of T = 3, 5 and 10, respectively. The median worst-case predicted Gram-negative MIC across seeds is 108.8 μmol l−1 for ApexGO, versus 210.6 μmol l−1 (T = 3), 192.1 μmol l−1 (T = 5) and 302.3 μmol l−1 (T = 10) for HydrAMP (Supplementary Figs. 13 and 14). To further assess HydrAMP in a ground-truth experimental setting, we synthesized the top-two HydrAMP-generated analogues for each of the ten seed templates (20 peptides in total; we were not able to synthesize one of the selected peptides using solid-phase peptide synthesis) and measured their MIC values against the same panel of 11 clinically relevant pathogens used to evaluate ApexGO. HydrAMP’s performance was highly seed dependent. For templates whose sequences resemble canonical AMPs, well represented in HydrAMP’s training set, which were short, cationic, leucine/lysine-rich scaffolds such as mammuthusin-3 (KTLKIIRLLF, ten amino acid residues), mylodonin-2 (KRKRGLKLATALSLNNKF, 18 residues long) and mammuthusin-2 (26 amino acid residues, arginine rich), HydrAMP produced potent derivatives, with HydrAMP-12 and HydrAMP-14 achieving MICs as low as 1 μmol l−1 against A. baumannii and E. coli strains (Supplementary Fig. 15). However, for templates with sequence motifs atypical of known AMPs, particularly the de-extinct peptides hesperelin-3 (RQKNHGIHFRVLAKALR, containing the unusual HGIH motif) and lophiosin-1 (HWITINTIKLSISLKI, with an N-terminal HW-TINT motif), both HydrAMP derivatives were completely inactive (MIC > 64 μmol l−1 against all strains tested). A similar pattern was observed for hydrodamin-2 (RMARNLVRYVQGLKKKKVI), where HydrAMP derivatives showed only marginal activity (MIC, 32–64 μmol l−1, against three out of seven Gram-negative strains). This seed-dependent performance is consistent with a distribution mismatch: HydrAMP’s conditional VAE, trained on curated AMP databases, generates derivatives that conform to the sequence patterns of known AMPs and struggles to optimize scaffolds that fall outside this learned distribution. By contrast, ApexGO produced experimentally active derivatives (MIC ≤ 64 μmol l−1 against ≥3 Gram-negative strains) for all ten templates, including hesperelin-3 and lophiosin-1, because its BO loop guided by the APEX oracle does not rely on the generative model having previously encountered similar sequences during training, only on the oracle’s ability to score proposed edits. These results illustrate a fundamental distinction between one-shot generative approaches, which are effective within their training distribution, and optimization-based frameworks like ApexGO that can navigate unfamiliar sequence neighbourhoods through iterative, feedback-driven search (Supplementary Fig. 15).
PepDiffusion combines a transformer-based VAE with a conditional latent diffusion model trained on AMP and non-AMP sequences, followed by classifier- and MD-based filtering. As a baseline for our derivative design task, we used the best-performing VAE and conditional diffusion checkpoints and their default sampling hyperparameters (500 diffusion steps with a maximum length of 50), conditioning on the AMP class label (cond_label = 0). We generated 1,000,000 unique candidate sequences in this manner. Similar to HydrAMP, we then computed the Levenshtein-distance-based similarity between each candidate and each of our ten seed templates and filtered to those with similarity of \(\ge 75 \%\) to at least one seed. In this constrained task, PepDiffusion did not produce any sequences above the similarity threshold for any seed, so no top-K derivative sets could be formed, and no further objective comparison was possible. This outcome is consistent with the model’s intended use for template-free, diversity-oriented AMP discovery rather than per-template-constrained optimization.
Sequence space exploration
Our primary objective was to identify peptides with enhanced antimicrobial activity. Accordingly, our experimental approach in this study focuses chiefly on modifying template peptides from extinct animals. To evaluate the capacity of ApexGO to navigate the full sequence search space, we performed optimization and completely relaxed the similarity constraint, optimizing peptides for four different objectives: peptides generated with 0% similarity constraint (Free), peptides with predicted broad-spectrum activity and 0% similarity constraint (Broad-free), peptides with at least 75% dissimilarity to known AMPs (Free-75%diff) and peptides with at least 75% dissimilarity to known AMPs and predicted broad-spectrum activity (Broad-free-75%diff). This approach allowed the optimizer to generate peptides without restriction to template sequences (Supplementary Table 2). These similarity levels (typically 40%–60%) fall below the ≥70% identity threshold commonly used to define analogues, reinforcing that ApexGO-generated peptides are distinct. The resulting peptides exhibited antimicrobial activity, with some displaying potency at very low concentrations (1–2 μmol l−1) (Supplementary Fig. 16). In particular, the optimizer generated peptides that are highly dissimilar to the original templates, as quantified by the edit distance (Supplementary Fig. 17).
Striped Smith–Waterman alignment-based similarity score
We use \({\rm{SSW}}(a,b)\) to denote the optimal alignment score of protein sequences \(a\) and \(b\) using the Striped Smith–Waterman algorithm (SSW)52. The SSW similarity score can then be defined as \(\frac{{\rm{SSW}}(a,b)\,}{\sqrt{{\rm{SSW}}\left(a,a\right)\times {\rm{SSW}}(b,b)\,}}\).
Peptide synthesis
All peptides for the experiments were obtained from AAPPTec and synthesized using solid-phase peptide synthesis with the Fmoc strategy. All peptides were de-salted and determined to be >90% pure by high-performance liquid chromatography coupled to mass spectrometry analysis.
Culturing conditions and bacterial strains
In this study, we used the following pathogenic bacterial strains: A. baumannii ATCC 19606, E. coli ATCC 11775, E. coli AIC221 [E. coli MG1655 phnE_2::FRT (control strain for AIC 222)], E. coli AIC222 [E. coli MG1655 pmrA53 phnE_2::FRT (polymyxin resistant; colistin-resistant strain)], K. pneumoniae ATCC 13883, P. aeruginosa PAO1, P. aeruginosa PA14, Staphylococcus aureus ATCC 12600, S. aureus ATCC BAA-1556 (methicillin-resistant strain), Enterococcus faecalis ATCC 700802 (vancomycin-resistant strain), and Enterococcus faecium ATCC 700221 (vancomycin-resistant strain). Pseudomonas Isolation (P. aeruginosa strains) agar plates were exclusively used in the case of Pseudomonas species. All the other pathogens were grown in Luria–Bertani (LB) broth and on LB agar. In all the experiments, bacteria were inoculated from one-isolated colony and grown overnight (16 h) in a liquid medium at 37 °C. On the following day, inoculums were diluted 1:100 in fresh media and incubated at 37 °C to mid-logarithmic phase.
MIC assays
Broth microdilution assays were conducted to establish the MIC for each peptide53,54,55. Peptides were added to untreated polystyrene 96-well microtitre plates and serially diluted twofold in sterile water, ranging from 0 to 64 μmol l−1. A bacterial inoculum at a concentration of 106 CFU ml−1 in LB medium was then mixed in a 1:1 ratio with the peptide solution. The MIC was determined as the lowest peptide concentration that completely inhibited bacterial growth after 24 h of incubation at 37 °C. Each assay was performed in three independent replicates.
Circular dichroism experiments
The circular dichroism experiments were conducted using a J1500 circular dichroism spectropolarimeter (Jasco) in the Biological Chemistry Resource Center at the University of Pennsylvania. Experiments were performed at 25 °C, the spectra graphed are an average of three accumulations obtained with a quartz cuvette with an optical path length of 1.0 mm, ranging from 260 to 190 nm at a rate of 50 nm min−1 and a bandwidth of 0.5 nm. The concentration of all peptides tested was 50 μmol l−1, and the measurements were performed in water, a mixture of TFE and water in a 3:2 ratio, and SDS in water at 10 mmol l−1, with respective baselines recorded before measurement. A Fourier transform filter was applied to minimize the background effects. Secondary structure fraction values were calculated using the single spectra analysis tool on the server BeStSel56. Ternary plots were created in TernaryPlot.com (https://www.ternaryplot.com/) and subsequently edited.
Outer membrane permeabilization assays
The NPN uptake assay was used to evaluate the ability of the peptides to permeabilize the bacterial outer membrane. Inocula of A. baumannii ATCC 19606 were grown to an optical density (OD) at 600 nm of 0.4 ml−1, centrifuged (9,391g at 4 °C for 10 min), washed and resuspended in 5 mmol l−1 of HEPES buffer (pH 7.4) containing 5 mmol l−1 of glucose. The bacterial solution was added to a white 96-well plate (100 μl per well) together with 4 μl of NPN at 0.5 mmol l−1. Consequently, peptides diluted in water were added to each well, and the fluorescence was measured at λex = 350 nm and λem = 420 nm over time for 45 min. The relative fluorescence was calculated using the untreated control (buffer + bacteria + fluorescent dye) and polymyxin B (positive control) as baselines and the following equation was applied to reflect the percentage of difference between the baselines and the sample:
$$\begin{array}{l}{\rm{Percentage}}\,{\rm{difference}}\\ =\displaystyle \frac{100\times ({{\rm{fluorescence}}}_{{\rm{sample}}}-{{\rm{fluorescence}}}_{{\rm{untreated}}{\rm{control}}})}{{{\rm{fluorescence}}}_{{\rm{untreated}}{\rm{control}}}}\end{array}.$$
Cytoplasmic membrane depolarization assays
The cytoplasmic membrane depolarization assay was performed using the membrane-potential-sensitive dye DiSC3-5. A. baumannii ATCC 19606 in the mid-logarithmic phase were washed and resuspended at 0.05 OD ml−1 (optical value at 600 nm) in HEPES buffer (pH 7.2) containing 20 mmol l−1 of glucose and 0.1 mol l−1 of KCl. DiSC3-5 (20 μmol l−1) was added to the bacterial suspension (100 μl per well) for 15 min to stabilize the fluorescence, which indicates the incorporation of the dye into the bacterial membrane, and then the peptides were mixed 1:1 with the bacteria to a final concentration corresponding to their MIC values. Membrane depolarization was then followed by reading changes in the fluorescence (λex = 622 nm, λem = 670 nm) over time for 60 min. The relative fluorescence was calculated using the untreated control (buffer + bacteria + fluorescent dye) and polymyxin B (positive control) as baselines and the following equation was applied to reflect the percentage of difference between the baselines and the sample:
$$\begin{array}{ll}{\rm{Percentage}}\,{\rm{difference}}\\ =\displaystyle \frac{100\times ({\text{fluorescence}}_{{\rm{sample}}}-{{\rm{fluorescence}}}_{{\rm{untreated}}{\rm{control}}})}{{{\rm{fluorescence}}}_{{\rm{untreated}}{\rm{control}}}}\end{array}.$$
Cytotoxicity assays
One day before the experiment, an aliquot of 100 μl of the cells at 50,000 cells ml−1 was seeded into each well of the cell-treated 96-well plates used in the experiment. The attached HEK293T cells were then exposed to increasing concentrations of the peptides (8–128 μmol l−1) for 24 h. After the incubation period, we performed the 3-(4,5-dimethylthiazol-2-yl)-2,5-diphenyltetrazolium bromide tetrazolium reduction assay (MTT assay)55. The MTT reagent was dissolved at 0.5 mg ml−1 in the medium without phenol red and was used to replace cell culture supernatants containing the peptides (100 μl per well). The samples were incubated for 4 h at 37 °C in a humidified atmosphere containing 5% CO2, yielding the insoluble formazan salt. The resulting salts were then resuspended in hydrochloric acid (0.04 mol l−1) in anhydrous isopropanol and quantified by spectrophotometric measurements of absorbance at 570 nm. All assays were done as three biological replicates.
Resistance to proteolytic degradation assay
The stability of the peptides against enzymatic degradation was assessed by incubation in a solution containing 25% human serum in water. Specifically, the peptides, at a concentration of 10 mg ml−1, were incubated with an aqueous solution of 25% human serum (Zen-Bio; healthy donor, blood type A–) for 6 h. Samples were collected at 0, 0.5, 1, 2, 4 and 6 h, and each aliquot was immediately treated with 10 μl of trifluoroacetic acid for 10 min to halt the enzymatic activity. The analyses were performed using a Waters Acquity ultrahigh-performance liquid chromatography–mass spectrometry system featuring a photodiode array detector (190–400-nm data collection) and a Waters single quadrupole detector 2. The setup included a Waters XBridge C18 column (3.5 µm, 4.6 mm × 50 mm), with a mobile phase consisting of 100% water containing 0.1% (v/v) formic acid (solvent A) and 100% acetonitrile (solvent B). Both solvents were of the Fisher Optima grade. A 50 μl of injection volume was used, and ionization was carried out in both positive and negative electrospray ionization modes, scanning a mass range of m/z 100–3,000. The gradient used consisted of 5%–95% solvent B for 5 min. The proportion of intact peptide remaining at each time point was calculated by integrating the area under the curve of the peptide peak at the initial time (t = 0) as a reference. The experiments were done in three replicates.
Skin abscess infection mouse model
The back of six-week-old female CD-1 mice under anaesthesia were shaved and injured with a superficial linear skin abrasion made with a needle. An aliquot of A. baumannii ATCC 19606 (5 × 10⁵ CFU ml−1; 20 μl) previously grown in LB medium until 0.5 OD ml−1 (optical value at 600 nm) and then washed twice with sterile PBS (pH 7.4, 9,391g for 3 min) was added to the scratched area. A single dose of peptides or antibiotics (positive control groups) diluted in sterile water at their MIC value were administered to the wounded area 1 h post-infection. Two- and four-days post-infection, animals were euthanized, and the scarified skin was excised, homogenized using a bead beater (25 Hz for 20 min), tenfold serially diluted and plated on McConkey agar plates for CFU quantification. The experiments were performed using four mice per group. The skin abscess infection mouse model was revised and approved by the University Laboratory Animal Resources from the University of Pennsylvania (protocol number 806763).
Deep thigh infection mouse model
Experiments were performed using six-week-old female CD-1 mice, which were rendered neutropenic by the intraperitoneal application of two doses of cyclophosphamide (150 mg kg−1 and 100 mg kg−1) 3 days and 1 day before the infection. On day 4 of the experiment, the mice were infected in their right thigh through a 100 μl of intramuscular injection of A. baumannii ATCC19606 (in PBS at a concentration of 9 × 10⁵ CFU ml−1). The bacterial cells were grown in LB broth, washed twice with PBS solution and diluted at the desired concentration before infecting the mice. Peptides or antibiotics (positive control groups) were administered as a single dose intraperitoneally 2 h after the infection. Four days post-infection, the mice were euthanized, and the tissue from the right thigh was excised, homogenized using a bead beater (25 Hz for 20 min), tenfold serially diluted and plated on McConkey agar plates for counting the bacterial colonies. The experiments were performed using four mice per group. The deep thigh infection mouse model was revised and approved by the University Laboratory Animal Resources from the University of Pennsylvania (protocol number 807055).
Reporting summary
Further information on research design is available in the Nature Portfolio Reporting Summary linked to this article.