Study population and cohort construction
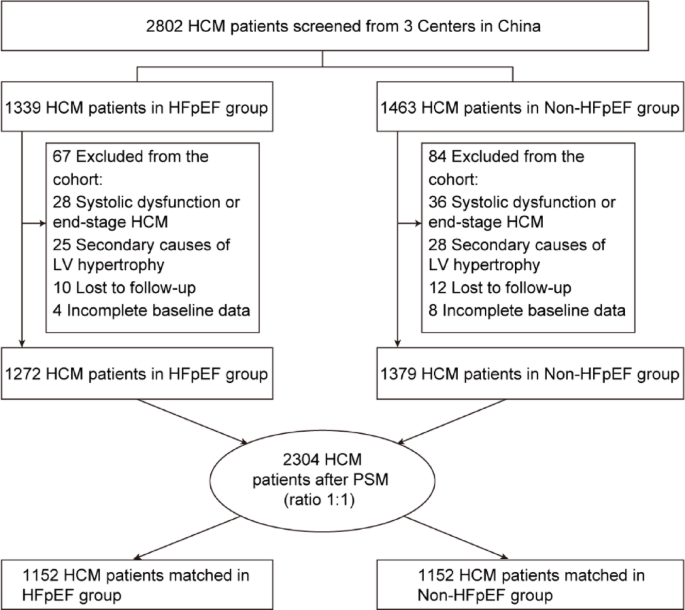
A total of 2,802 consecutive HCM patients were screened from three tertiary centers in China (Figure 1). Of these, 1,339 patients (47.8%) were classified as HFpEF and 1,463 patients (52.2%) were classified as non-HFpEF. After excluding patients with systolic dysfunction or end-stage HCM, secondary causes of left ventricular hypertrophy, loss to follow-up, or incomplete baseline data, 1,272 HFpEF patients and 1,379 non-HFpEF patients remained included in the analysis.
PSM was performed in a 1:1 ratio to reduce baseline imbalance between groups. This resulted in a matched cohort of 2,304 patients, consisting of 1,152 patients in the HFpEF group and 1,152 patients in the non-HFpEF group (Figure 1). BNP and NYHA functional classes were not included in the propensity score model because they reflect the burden of HFpEF and may be a causal link between HFpEF status and adverse outcomes. The distribution of propensity scores before and after matching is summarized in Supplementary Figure 1.

Flow diagram of patient selection and PSM cohort construction in HCM patients.
Baseline characteristics before and after propensity score matching
Baseline characteristics of patients before and after PSM are summarized in Table 1. Before matching, patients with HFpEF were significantly older than those without HFpEF (median age: 56.8 years vs. 51.3 years; P< 0.001), which showed a more advanced clinical profile. HFpEF patients had significantly higher BNP levels (median: 2410.05 vs. 410.15; P< 0.001), and the prevalence of NYHA functional class III–IV symptoms was significantly higher (18.7% vs. 6.3%; P< 0.001). History of syncope was also more frequent in the HFpEF group (20.1% vs. 17.9%; P= 0.043).
After propensity score matching, most baseline demographic, clinical, echocardiographic, and treatment variables were balanced between the two groups. There were no significant differences in age, gender distribution, BMI, prevalence of atrial fibrillation, chronic kidney disease, left ventricular septal thickness, or use of guideline-conforming medications. Despite concordance, BNP levels remained significantly higher in the HFpEF group compared to the non-HFpEF group (median: 981.63 vs. 565.46 pg/mL; P< 0.001). Similarly, NYHA functional class III-IV symptoms remained more prevalent among HFpEF patients (16.0% vs. 7.4%; P< 0.001), indicating persistent differences in hemodynamic burden between groups even after adjustment (Table 1).
Risk subgrouping based on H₂FPEF score
Receiver operating characteristic analysis identified an optimal H₂FPEF score cutoff of 5.4 to identify adverse outcomes, with an AUC of 0.826, a sensitivity of 79.6%, and a specificity of 89.3% (P< 0.001) (Figure 2).

ROC curve analysis of H2FPEF score for predicting adverse outcomes in hypertrophic cardiomyopathy patients.
Based on this cutoff, patients are further classified as HFpEF-High (n= 534) and HFpEF-Low (n= 1770) group. Compared to the HFpEF-Low group, HFpEF-High patients showed substantially higher circulating BNP levels (median: 994.63 vs. 624.40 pg/mL, P< 0.001) and a significantly higher prevalence of New York Heart Association (NYHA) functional class III-IV symptoms (17.2% vs. 7.9%; P< 0.001). Other baseline characteristics such as age, gender, comorbidities, and echocardiographic parameters were similar between the two subgroups (Table 2).
Association between HFpEF status and event-free survival
Kaplan-Meier analysis during follow-up demonstrated significantly lower event-free survival in HFpEF patients compared to propensity score matched non-HFpEF patients (log-rank) P< 0.001) (Figure 3A). At approximately 5 years of follow-up, event-free survival was significantly lower in the HFpEF group, with an absolute difference of nearly 20% compared with the non-HFpEF group. This gap persisted and widened further over time. This indicates a persistent divergence in long-term outcomes.
Similarly, when patients were stratified according to risk subgroups based on H₂FPEF score, patients classified as HFpEF-High had significantly worse event-free survival than the HFpEF-Low group (log-rank) P< 0.001) (Figure 3B). Event-free survival was consistently lower in the HFpEF-High group throughout follow-up, supporting a graded relationship between risk subgroups and adverse outcomes based on H₂FPEF score.

Kaplan-Meier curves of event-free survival based on HFpEF status and risk subgroups based on H₂FPEF score in HCM patients.
Predictors of adverse outcome in Cox proportional hazards analysis
In univariate Cox regression analysis, atrial fibrillation, BNP levels (per 100 pg/mL increase), and HFpEF status were each significantly associated with adverse events (Table 3). Compared with non-HFpEF patients, HFpEF patients had a significantly increased risk of adverse outcomes (HR = 2.545; 95% CI, 1.155 to 4.480; P< 0.001).
In multivariate Cox regression analysis adjusting for established clinical risk factors such as age, atrial fibrillation, history of syncope, chronic kidney disease, left ventricular septal thickness, and BNP level, HFpEF remained an independent predictor of adverse outcome (HR = 2.463; 95% CI, 1.179-4.170; P< 0.001) (Table 4, Model 2).
When risk subgroups based on H₂FPEF score were included in the model, patients classified as HFpEF-High had a significantly higher risk of adverse events compared to the HFpEF-Low group (HR = 2.925, 95% CI, 2.210-3.701; P< 0.001) (Table 4, Model 3).
Across all multivariable models, BNP levels and atrial fibrillation consistently emerged as independent predictors of adverse outcomes. These associations are visually summarized in a multivariable Cox regression forest plot (Figure 4).

Forest plot of multivariable Cox proportional hazards regression for predictors of adverse outcome in patients with hypertrophic cardiomyopathy.
Nonlinear association between BNP levels and adverse outcomes
BNP was modeled as a continuous variable in Cox regression to provide clinically interpretable hazard ratios, and restricted cubic spline analysis was used to assess potential nonlinear associations across the BNP spectrum. Restricted cubic spline analysis showed a significant nonlinear association between BNP levels and risk of adverse outcomes after adjusting for established clinical covariates (P for overall association < 0.001; P for nonlinearity = 0.042). Using a BNP level of 810 pg/mL as a reference value, the hazard ratio gradually increased with increasing BNP concentration, with a more pronounced increase observed at higher BNP ranges. The distribution of BNP values within the study population is displayed alongside a spline curve to show the data density across BNP levels (Figure 5).

Restricted cubic spline analysis showing nonlinear association between BNP levels and risk of adverse outcome.
Performance of machine learning models for outcome prediction
Four machine learning models (k-nearest neighbors, logistic regression, support vector machines, and random forests) were developed to predict adverse outcomes using key clinical variables. On the test set, the random forest model achieved the highest discriminatory performance among the evaluated models with an AUC of 0.856 compared to AUC of 0.803 for logistic regression, 0.760 for support vector machine, and AUC of 0.792 for k-nearest neighbors (Table 5). Decision curve analysis demonstrated that the random forest model provides higher net clinical benefits than alternative models over a wide range of clinically relevant threshold probabilities, particularly between approximately 0.10 and 0.70. The calibration analysis showed that the random forest model’s predicted and observed event risks were in good agreement, the calibration curve was closely aligned with the ideal baseline, and the slope of the calibration was close to 1 (Figure 6). Consistent performance is observed on the training dataset, indicating that the model’s discrimination is stable. (Supplementary Table 1 and Supplementary Figure 2)

ROC curves, decision curve analysis, and calibration plots for four machine learning models evaluated on the test set.
Interpretability of models using SHAP analysis
SHAP analysis was performed to assess the contribution of features within the random forest model. Based on mean absolute SHAP values, HFpEF status and BNP levels emerged as the most influential predictors of adverse outcome, followed by atrial fibrillation, age, chronic kidney disease, history of syncope, and left ventricular septal thickness (Figure 7).

SHAP-based interpretation of random forest models showing feature importance and direction of impact on outcome prediction.
SHAP dependence and summary plots demonstrated that higher BNP levels and the presence of HFpEF were associated with increased predicted risk, whereas the direction of other clinical characteristics was consistent with the effects observed in Cox proportional hazards analysis. These findings support the clinical interpretability and internal consistency of the machine learning model. Additional SHAP-dependent analyzes suggested that the contribution of BNP to predicted risk varied depending on AF status, providing further insight into the heterogeneity of risk within the model (Supplementary Figure 3).