Materials
Fresh kiwi fruits (Actinidia chinensis Planch.), green mangoes (Mangifera indica Linn.), and persimmons (Diospyros kaki Thunb.) were provided by the plantation at Yantai (Shandong, China), Changjiang (Hainan, China), and Baoding (Hebei, China), respectively. The color developer was composed of BA and un-extractable hawthorn polyphenols (A mass ratio of 1:2)17, and its major chemical compositions were shown in Supplementary Table 1. Soy protein isolate, citrus pectin, garlic essential oil (GEO), konjac glucomannan (KGM), methacrylic anhydride (MA), deuterium oxide, Nile red, ethanol, fluorescein isothiocyanate (FITC), potassium bromide, potassium nitrate, cellulose dialysis membrane (Mw of 8-14 kDa), and additional reagents were sourced from Bailingwei Chemical Technology Co., Ltd. (Shanghai, China). A light-emitting diode with the following parameters was used: wavelength of 445 nm, operating current of 2.0 mA, and power density of 3 W/cm². A polypropylene packaging box (See Supplementary Fig. 5) measuring 181 × 107 × 75 mm had a wall thickness of 0.52 mm and a light transmittance of 80%.
Classification of quality levels of respiring climacteric fruits
As reported by Teng et al. 10 with slight modifications, kiwi fruits/green mangoes/persimmons of 1 kg were stored in the plastic box containing a sheet of kitchen absorbent paper (Length × width of 200 × 110 mm) and a hygrometer (RH820U, DwyerOmega, America) at 25 °C. Due to the irreversible damage caused by the quality assessment, each type of fruit was divided into 100 test groups for the repeated experiment. Three groups were randomly selected from the 100 test groups to measure relative humidity and carbon dioxide levels in the plastic box daily. Next, the fruit was removed for physicochemical analysis including measurements of hardness, titratable acid content, soluble solid content, weight loss rate, and sensory evaluation. Based on the above chemical indexes, the quality levels of fruits were distinguished using principal component analysis (PCA).
Relative humidity: The value of relative humidity in the plastic box was displayed by the hygrometer10 (WS101, Kehui Instrument Factory, Tianjin, China).
Carbon dioxide content: An infrared gas analyzer (IR400, Yokogawa Co., Ltd., Yokohama, Japan) was used32. Base on the data of carbon dioxide content, the respiration rate of fruits was calculated as mass of carbon dioxide produced by 1 kg fruits per unit time.
Relationship between carbon dioxide content and pH value: A small glass bottle containing 10 mL pure water was placed in a wide-mouthed bottle. Different volume fractions of premixed gases (carbon dioxide and nitrogen) were introduced into this wide-mouthed bottle at 25 °C. After the gas composition stabilized for 3 min, the pH value of the carbonated solution in the small glass bottle was measured. A functional relationship between the carbon dioxide content and the pH value was established using Origin 2022 software (OriginLab Corporation, Massachusetts, USA). After that, 5 points were randomly selected to measure the actual pH value for verifying the accuracy of the equation. Based on this, the pH range altered by the carbon dioxide produced by fruits was calculated. Subsequently, solutions within this pH range were prepared to test the colorimetric ability of the color developer. The colorimetric ability was represented by RGB (Red, green, and blue) images generated using Adobe Photoshop 2024 software (Adobe Systems, California, USA)33. These RGB images displayed the color variations of the color developer at different pH values, compared with pH = 7.0.
Hardness: A texture analyzer (TA. XTPlus, Stable Micro Systems, Surrey, UK) with a P/2 probe was used. Speed before/after test, test speed, a trigger power, and test distance were set at 5.00 mm/s, 1 mm/s, 50 N, and 30 mm, respectively34.
Titratable acid content: The mixture including 20 g fruit homogenate and 250 mL deionized water was filtered. Then, the acid-base titration method was performed35.
Soluble solid content: A hand portable refractometer (Pocket Pa-1, ATAGO, Tokyo, Japan) was used to determine the soluble solid content36. The sample solution was deposited onto the prism surface, followed by the closure of the cover plate. The instrument was then directed toward a light source for observation until a sharp and stable light-dark boundary appeared in the viewfinder. The value displayed at this point represented the soluble solids content.
Weight loss rate: The weight loss rate was calculated based on the mass difference between the initial weight and the weight after a specified storage period37.
Sensory evaluation: A trained sensory panel of ten members (Aged between 20 and 38, four males and six females) evaluated the fruits for various sensory parameters namely overall appearance and taste. Recognition and threshold test as well as routine Hedonic tests were performed in the laboratory. The sequence of sample presentation was randomized using the Williams Latin square design, and there was a 5 min break between the samples to cleanse the palate with water and soda biscuits37. Panelists were asked to evaluate each sample based on standard 5-point Hedonic scale. The evaluation criteria were provided in Supplementary Table 238. The sensory evaluation was approved by the School of Food Science and Technology at Jiangnan University, confirming that the study complies with local ethical standards, and informed consent was obtained from all participants.
Preparation of printing substate and antibacterial agent
Printing substate (MAKGM)
Following the method reported by Teng et al. 18, the mixture of 1% (w/v) KGM and 3% (v/v) MA was prepared at pH = 7.0 and stirred at 300 r/min in a 40 °C water bath for 8 h, after which a ten-fold volume of acetone was added. The precipitate was purified through three ethanol washes, a 5-day dialysis process, and then freeze-drying for storage39. The grafting degree was determined to be 15%.
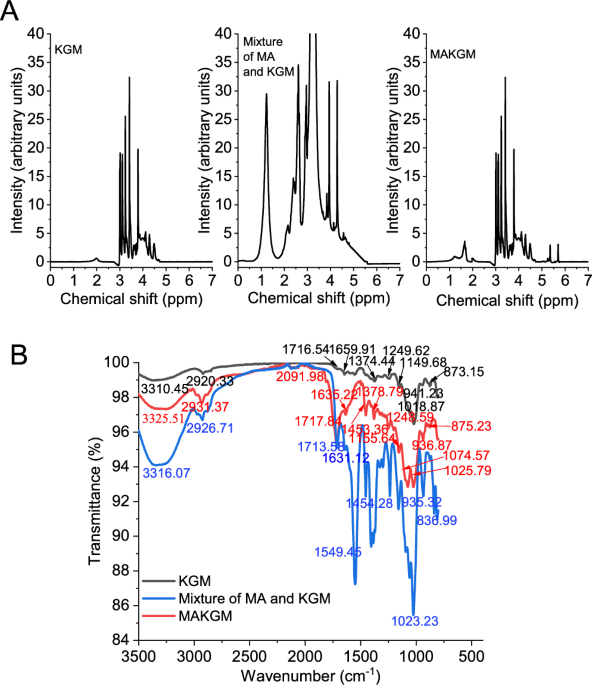
The confirmation of successful grafting was obtained from 1H-nuclear magnetic resonance spectra (1H NMR) and attenuated total reflectance-Fourier transform infrared spectra (ATR-FTIR). For 1H NMR spectra24, 30 mg sample (Including KGM, the physical mixture of MA and KGM, and MAKGM) was dissolved in 1.2 mL deuterium oxide, transferred to a 5 mm NMR tube, and incubated at 40 °C for 24 h. ¹H NMR spectra were acquired on a 600 MHz spectrometer (AVANCE NEO, Bruker Co., Switzerland, Germany). For ATR-FTIR spectra6, 20 mL 1% (w/v) sample solution was poured into round Petri dishes of a 90 mm diameter. These dishes were then placed in an oven at 40 °C for 12 h to produce films. ATR-FTIR spectra of these films were acquired using a Nicolet IS10 spectrometer (Nicolet Co., Madison, America) with 32 scans and a resolution of 4 cm⁻¹ across the 4000-800 cm⁻¹ range.
Antibacterial agent (GEO emulsion)
The method was performed as reported by Teng et al. 18 with minor modifications. The emulsifier was synthesized by subjecting a 1:1 (w/w) mixture of soy protein isolate and pectin to 8 cycles of a two-step process. Each cycle consisted of hydration to 75% moisture in a saturated potassium bromide solution at 25 °C for 11 h, followed by microwave vacuum drying at 1.5 W/g for 10 min. The emulsion was then prepared by homogenizing 8 g GEO and 2 g emulsifier in 90 mL water using high-shear (10,000 r/min, 10 min) and high-pressure (40 MPa, 5 passes) steps. The final product was collected by centrifugation (300 × g, 10 min) and stored at 4 °C. The encapsulation efficiency of GEO was 83%.
Preparation of cast and printed labels
The preparation flowchart for cast and printed labels is shown in Supplementary Fig. 5. The final moisture content of both cast and printed labels was 13% (w/w).
4D printed labels with different formulations
A dual nozzle printer (FoodBot D, Shiyin Technology Co., Ltd., Hangzhou, China) was used as the printing tool with a printing nozzle diameter of 0.4 mm and a printing speed of 15 mm/s. As shown in Supplementary Fig. 5, the printed labels were cuboid, featuring the upper and lower structures. The printing ink of the upper structure contained 3% (w/v) MAKGM, 0.2% (w/v) color developer, and 0.08% (w/v) riboflavin. Compared with the upper structure ink, the composition of the lower structure ink did not include the color developer, but contained different mass ratios of GEO emulsion (0%, 6%, 8%, 10%, 12%, and 14%, w/w). At this stage, the upper structure was designed with a single layer, a 30% infill ratio, and a 90° filament interaction angle relative to the lower structure. The lower structure was designed as a single layer with a 100% infill ratio. The printed labels were irradiated using LED light for 5 min and then placed in a fume hood for 12 h. These obtained labels were placed in a dark drying dish for later use.
4D printed labels with different geometric designs
According to the deformation degree (Evaluated using the method in section Determination of deformation degree) of printed labels, the optimal addition of GEO emulsion was determined. Subsequently, the influence of different geometric designs of the upper structure on the deformation degree was studied. Supplementary Fig. 7 displays the printed models. These printed models were produced by Rhinoceros 5.0 (Robert McNeel & Associates, Washington, USA), and the STL files were output. The STL files were sliced using Repetier-Host software (Hot-World GmbH & Co. KG, Würzburg, Germany). Then, G-codes were generated to guide the printing path of the 3D printer. The differences in the printing models were reflected in the layer number of the upper structure, the filament intersection angle between the upper and lower structures, and the infill ratio. Each parameter was varied individually whilst keeping the other parameters constant.
(1) The layer number of the upper structure was set to different values of 1, 2, 3, and 4, maintaining an infill ratio of 30% and a filament interaction angle of 90°. (2) The filament interaction angle was set to different values of 0°, 30°, 60°, and 90° with the upper layer number of 1 and an infill ratio of 30%. (3) The infill ratio of the upper structure was set to different values of 30%, 50%, 70%, and 90%, while keeping the upper layer number of 1 and a filament interaction angle of 90°.
3D printed labels
Since mixing the color developer with GEO emulsion altered the initial color and monitoring sensitivity, 3D printed labels prepared in this study also featured the upper and lower structures. However, unlike 4D printed labels, the upper layer of 3D printed labels featured an infill ratio of 100%. Preliminary experiments showed that a 100% infill ratio in the upper layer was required to prevent shape deformation in the printed labels. All other preparation steps were consistent with those used for 4D printed labels.
Cast labels
Consistent with the preparation of printed labels, cast labels were also composed of the upper and lower structures. MAKGM containing GEO emulsion was used for the lower structure and poured into a petri dish, then dried at 25 °C for 5 h. For the upper structure, MAKGM containing the color developer was poured onto the pre-prepared film11. The assembled labels were irradiated with LED light for 5 min and subsequently placed in a fume hood for 12 h. The prepared labels were stored in a light-proof desiccator for subsequent applications.
Determination of deformation degree
Each label was placed in a drying dish containing a saturated potassium nitrate solution (Relative humidity of 93%) at 25 °C. Each label was tested once. Considering factors such as experimental consumption, parallel test groups, and a 7-day test period, 21 test groups were established for one sample in a replicated experiment. During the testing phase, labels were randomly removed from three drying dishes at 24-hour intervals. Each label was evenly divided into five segments based on its length, and each segment was documented through photography. The curvature of the cross-section was calculated using Image-Pro Plus 6.0 software (Media Cybernetics, Silver Spring, USA)10. The degree of deformation was expressed as the average curvature.
Determination of indexes affecting the deformation degree
Printing fidelity
The printing fidelity of the inks used for the upper and lower structures was tested, respectively. The printing parameters were set as follows: a hollow cylinder pattern with dimensions of 10 mm in diameter and 15 mm in height, a printing nozzle diameter of 0.4 mm, and a printing speed of 15 mm/s. After printing, the printed objects were treated using LED irradiation for 5 min, and photographed by a digital camera (OnePlus 9 R, Shenzhen oneplus Technology Company Limited, Shenzhen, China). The printing fidelity was measured using Image-Pro Plus 6.0 software (Media Cybernetics, Silver Spring, USA), and it was calculated using the following Eq. (1)25:
$$ {{\rm{Printing}}}\; {{\rm{fidelity}}}\left(\%\right)=\\ \left(1-\frac{\left|{{\rm{bottom}}}\; {{\rm{area}}}\; {{\rm{of}}}\; {{\rm{printed}}}\; {{\rm{object}}}-{{\rm{bottom}}}\; {{\rm{area}}}\; {{\rm{of}}}\; {{\rm{model}}}\right|\times {{\rm{height}}}\; {{\rm{of}}}\; {{\rm{printed}}}\; {{\rm{object}}}}{{{\rm{bottom}}}\; {{\rm{area}}}\; {{\rm{of}}}\; {{\rm{model}}}\times {{\rm{height}}}\; {{\rm{of}}}\; {{\rm{model}}}}\right) \times 100$$
(1)
Surface hydrophobicity
The materials forming the upper and lower structures were printed into films, respectively. The diameter of a printing nozzle was 0.4 mm, and the infill ratio was 100%. The surface hydrophobicity of these films was quantified by measuring the contact angle using a video contact angle measuring equipment (OCA15EC, Dataphy Instruments Co., Ltd., Nürtingen, Germany)40. MilliQ water (10 μL) dropped onto the surface of the film (Length × width of 3 × 3 cm), and the result was captured using a high-speed camera. The contact angle measurements were taken at 5 different points on each film, with a total of 5 films used as replicates.
Water content
The printed samples (Length × width of 3 × 3 cm) were stored in a drying dish at 93% relative humidity and 25 °C for 7 days. Samples were taken every 24 h to measure their moisture content. The water content was determined using the weight difference method41. Briefly, the tested sample was weighed to get its initial weight (W0), and dried at 105 °C after water absorption to reach a constant weight (W1). Equation (2) for calculating moisture content was as follows:
$${{\rm{Moisture}}}\; {{\rm{content}}}(\%)=\left(\frac{{W}_{0}-{W}_{1}}{{W}_{0}}\right)\times 100$$
(2)
Microstructure
A field emission scanning electron microscopy (FESEM, Su8100, Hitachi High-Tech Group, Tokyo, Japan) and a confocal laser scanning microscope (CLSM, Axio Vert A1, Carl Zeiss AG, Oberkochen, Germany) were used to characterize the internal structure of the labels. For FESEM images42, the labels before and after deformation were freeze-dried, and then fractured in liquid nitrogen. Prior to observation, samples were mounted on metal grids and coated with gold under vacuum. Microstructure of the lower structure of the tested labels was observed using FESEM with an accelerating voltage of 3 kV43,44.
To observe the network structure and GEO distribution before light exposure, the materials used for the upper and lower structures of the labels were poured separately into petri dishes to form a 0.1 mm film. Then, these films (Length × width of 1 × 1 cm) were mounted on glass slides, stained with 50 μL the mixed dye solution (0.1 mg/mL Nile Red and 0.5 mg/mL FITC), and incubated in the dark for 1 h45. After applying coverslips, the residual dye was removed by gently wicking from the slide edges. In order to observe the changes in network structure and GEO distribution after light exposure and water absorption, the test labels were sliced into 0.1 mm films using a cryo-sectionaliser (Leica CM3050 S, Leica Biosystems Nussloch GmbH, Nussloch, Germany)46. Then, staining was performed as described above. The excited wavenumber was set at 488 nm for Nile Red and 495 nm for FITC.
Molecular interaction
Firstly, 4 g printing ink (Used for the upper and lower structures of labels and subjected to LED irradiation) was dissolved in 100 mL deionized water and 8 mol/L urea, called gel A and B, respectively47. Then, gel strength (N) was measured using a texture analyzer (TA. XTPlus, Stable Micro Systems, Surrey, UK) with a cylindrical probe of P/0.5, and expressed as the maximum ordinate value of the first peak10. The strength of hydrogen bonds was determined as the difference in gel strength between gel A and B. To probe hydrophobic or electrostatic interactions, the urea solution was replaced with 0.1 mol/L sodium dodecyl sulfate or 0.8 mol/L sodium chloride, respectively47.
Total porosity
As described by Teng et al. 10, the weight of samples was determined with an Entris 64-1S electronic balance (Sartorius AG, Göttingen, Germany), and its volume (Length, width, and height) was measured using an Alton M820-25 handheld micrometer (Alton Inspection Technologies, Shanghai, China). The bulk density (g cm-3) was calculated according to Eq. (3)11. The particle density (g cm-3) was determined by liquid displacement using xylene (density = 0.864 g cm-3). Prior to this measurement, the samples were cryogenically ground in liquid nitrogen and weighed. The particle density and total porosity were calculated using Eqs. (4) and (5)11, respectively.
$${{\rm{Bulk}}}\; {{\rm{density}}}({{\rm{g}}} \, {{{\rm{cm}}}}^{-3})=\frac{{{\rm{Weight}}}\; {{\rm{of}}}\; {{\rm{the}}}\; {{\rm{dried}}}\; {{\rm{sample}}} \, \left({{\rm{g}}}\right)}{{{\rm{Volume}}}\; {{\rm{of}}}\; {{\rm{the}}}\; {{\rm{dried}}}\; {{\rm{samples}}} \, ({{{\rm{cm}}}}^{3})}$$
(3)
$${{\rm{Particle}}}\; {{\rm{density}}}({{\rm{g}}} \, {{{\rm{cm}}}}^{-3})=\frac{0.864\times ({m}_{3}-{m}_{1})}{{m}_{2}+({m}_{3}-{m}_{1})-{m}_{4}}$$
(4)
$${{\rm{Total}}}\; {{\rm{porosity}}} \, (\%)=\left(1-\frac{{{\rm{bulk}}}\; {{\rm{density}}}}{{{\rm{particle}}}\; {{\rm{density}}}}\right)\times 100$$
(5)
Where m₁, m2, m3, and m4 were the mass of the empty pycnometer (g), pycnometer + xylene (g), pycnometer + sample (g), and pycnometer + xylene + sample (g), respectively.
Determination of GEO release
The tested labels were cryogenically ground into small pieces using liquid nitrogen. These pieces were mixed with 95% (v/v) ethyl alcohol, followed by ultrasonic treatment at a specific input power of 4 W/g at 20 °C for 15 min. After centrifugation at 348 ×g for 20 min, the absorbance of the supernatant was measured at 278 nm using an ultraviolet-visible spectrophotometer (UV-1800, Shimadzu, Kyoto, Japan)28. The standard curve was established as follows: y (i.e., absorbance) = −3.12156 + 18.12497 x (i.e., GEO concentration). The amount of GEO released was calculated as the difference between the original amount and the measured value. To elucidate the release mechanism, the data were analyzed using the Ritger-Peppas model (Eq. 6)22:
$${{\rm{R}}}{{\rm{itger}}}-{{\rm{Peppas}}}:\frac{{M}_{t}}{{M}_{\infty }}=k \, {t}^{n}+A$$
(6)
where Mt/M∞, k and n are the release fraction of GEO released at time (%), release rate constant and release exponent, respectively.
Application in respiring climacteric fruits
Fruit-label pairs (Each containing 1 kg of fruit and a cast/3D printed/4D printed label with dimensions of 4 × 1 cm) were stored in the plastic boxes (Supplementary Fig. 5) at 25 °C, with boxes containing only fruit serving as controls. The measured parameters included sensory evaluations of the fruit’s external appearance and state, changes in the color and shape of labels, cumulative GEO release, and total bacterial count. Photographic documentation and quantitative recordings were performed every 24 h. As the measurements were destructive, each box yielded only one data point. For each replication cycle, the experimental groups assigned to a single sample were scaled to triple the total duration of the evaluation period. The lower structure of all labels contained 10% (w/w) GEO emulsion and 0.08% (w/v) riboflavin, whereas the upper structure contained 0.2% (w/v) color developer and 0.08% (w/v) riboflavin. The infill ratio of the lower structure in the printed labels was set to 100%. For the upper structure, the infill ratios of the 3D printed and 4D printed labels were 100% and 30%, respectively. The filament intersection angle was set to 60°.
Applications of lightweight deep convolutional neural network (DCNN) models
The prediction performance of various combinations between three label types and four lightweight DCNN models was systematically evaluated for monitoring the freshness of respiring climacteric fruits. The evaluation was conducted using an image dataset containing multiple typical fruit types across 3-4 quality levels. According to the method of Teng et al. 10, the images were standardized by normalizing them using the mean and standard deviation of ImageNet. If a custom dataset exhibited a noticeably different distribution, these values were recomputed. Next, data diversity was enhanced through dynamic data augmentation techniques such as random horizontal flipping, rotation, scaling, cropping, and color jittering. Finally, corrupted files and outlier samples were cleaned, and the dataset was divided into an 8:2 train-test split. The models were implemented in PyCharm Community Edition 2023 (JetBrains, Prague, Czech Republic) and evaluated using prediction accuracy10.
To detect and correct label noise, a multi-model cross-validation strategy was carried out. The specific process was as follows: The dataset was divided into five mutually exclusive subsets. Each subset was served as a validation set in turn while the remaining subsets were used for training. During the cross-validation process, the predictions of each sample across different models were recorded, and samples with predictions from most models contradicting the original label (e.g., 80% predicted class A, but labeled as class B) were identified. These high-confidence conflicting samples were marked as potential annotation error candidates and were subsequently corrected through semi-automatic cleaning (Filtered based on model prediction probability thresholds). This approach not only effectively identified label noise but also leveraged the complementary nature of different models to reduce the risk of misjudgment, ultimately enhancing the reliability of the dataset labels.
Statistical analysis
Unless otherwise specified, all indicators were measured three times and each measurement consisted of three parallel groups. All results were collected using Origin 2022 software (OriginLab Corporation, Massachusetts, USA) and presented as mean ± standard deviation. Statistically significant (p < 0.05) was analyzed by one-way ANOVA and a Duncan’s test using IBM SPSS Statistics 28 software (IBM Corporation, New York, USA).
Reporting summary
Further information on research design is available in the Nature Portfolio Reporting Summary linked to this article.


