Learn about Microsoft Fabric and its ML applications through a project that analyzes Titanic passenger data.
This tutorial is an end-to-end demonstration of Microsoft Fabric that takes learners from descriptive and diagnostic analysis to predictive analysis using the popular Kaggle Titanic dataset. The goal of this tutorial is to train a binary classification machine learning model that can predict whether an individual survived or died on the Titanic based on personal information such as age, gender, and ticket class.
For the uninitiated, Microsoft Fabric is a relatively new Software as a Service data platform released in May 2023 that significantly lowers the barrier to entry into DataOps (DevOps for data projects), allowing organizations that lack the budget or specialized skills to become data-driven.
This tutorial shows step-by-step how to handle such a complete data pipeline. To achieve this, we utilize two different “data products”:
1. Diagnostic analysis data products
This focuses on data engineering to clean, process, and enrich data to support diagnostic analysis, ultimately resulting in an interactive Power BI report examining Titanic passenger demographics and survival rates.
2. Predictive Analytics Data Products
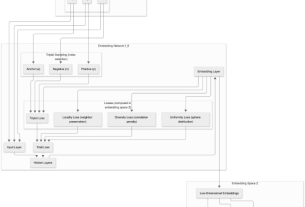
Use output from your first product to explore your data strategy, then train, test, and deploy machine learning models.
Throughout the series, the focus is on establishing strong DataOps practices for safely releasing features by adopting a product mindset driven by the Medallion Architecture. This architecture includes promoting data through bronze (raw data), silver (standardized and cleaned data), and gold (projected data for specific use cases) layers in the data lake.
This happens in the next part.
Part 1 (Overview)
Introduces courses, Kaggle datasets, data product concepts, and architectural principles.
Part 2 (Data Validation)
Learn how to use the “Great Expectations” Python package to establish data contracts that enforce data quality standards, remove bad records early in the pipeline, and alert your team to validation issues.
Part 3 (Testing the Notebook)
Teach test-driven development (TDD) principles and the Arrange, Act, Assert (AAA) pattern to establish automated testing of your fabric notebook’s data wrangling logic and create cleaner, more modular code.
Part 4 (Task Flow)
Demonstrates how to use Microsoft Fabric’s task flow features to visually organize workspace artifacts in a medallion architecture.
Part 5 (Observability)
Addresses how to track what’s happening within your production notebooks by integrating standard Python logging modules with Azure Application Insights to capture telemetry and continuously monitor the behavior of your data assets.
Along the way, you’ll also learn how to use Fabric and its various features.
- notes
- data pipeline
- lake house
- task flow
- workspace folder
- Data science and BI tools
Additionally, this series will show you how Fabric seamlessly integrates with external Azure services such as Azure Application Insights and standard Python logging modules to build centralized observability and telemetry for your data engineering processes.
Ultimately, although this course focuses on fabric, the techniques applied here can still be used by data engineers and data scientists who want to learn how to apply DataOps principles, medallion architecture, and test-driven development. Recommended.

Detailed information
Microsoft Fabric: Machine Learning Tutorials – YouTube Playlist
Related articles
Microsoft announces fabric data analytics
Microsoft adds IQ layer to Fabric
GitHub Copilot CLI for Beginners – Course
To stay informed about new articles in I Programmer, sign up for our weekly newsletter, subscribe to our RSS feed, and follow us on Facebook or Linkedin.


comment
Or email your comments to comments@i-programmer.info.