Evaluation metrics
To assess the performance of deep learning models for malaria parasite classification, several well-established evaluation metrics were employed. These include accuracy, precision, recall, F1-score, and AUC-ROC. Additionally, confusion matrix analysis was used to interpret classification results visually and quantitatively.
Accuracy is the most intuitive metric, representing the proportion of correctly classified samples to the total number of predictions. It is defined as:
$$\:Accuracy=\frac{TP+TN}{TP+TN+FP+FN}$$
where:
Precision
Precision measures the ratio of correctly predicted positive observations to the total predicted positives. It evaluates the model’s ability to avoid false positives:
$$\:Precision=\frac{TP}{TP+FN}$$
High precision indicates a low false positive rate, which is crucial in medical applications where misdiagnosing healthy individuals as infected must be minimized.
Recall (sensitivity)
Recall, or sensitivity, measures the ratio of correctly predicted positive observations to all actual positives. It emphasizes the model’s ability to detect true cases:
$$\:Recall=\frac{TP}{TP+FN}$$
High recall is critical in disease detection tasks to minimize false negatives, which could result in missed diagnoses.
F1-score
The F1-score is the harmonic mean of precision and recall. It balances the trade-off between these two metrics, particularly in imbalanced datasets:
$$\:F1\:score=\frac{2\times\:Precision\times\:Recall}{Precision+Recall}$$
A perfect F1-score of 1 indicates a model with both high precision and recall.
ROC curve
The Receiver Operating Characteristic (ROC) curve plots the True Positive Rate (TPR) against the False Positive Rate (FPR) at various threshold settings:
$$\:TPR\left(Recall\right)=\frac{TP}{TP+FN},\:\:FPR=\frac{FP}{FP+TN}$$
Classification report of baseline CNN architectures
In the initial phase of this study, we implemented and evaluated several standard CNN architectures to establish a baseline for malaria parasite classification using blood smear images. The empirical results demonstrated promising classification performance. Among the models tested, ResNet18 achieved the highest F1-score of 96.33%, followed by InceptionV3 (95.21%), VGG19 (94.76%), and MobileNetV2 (92.5%) indicated in Table 3.
While these models showed strong individual performance, further improvement was sought by leveraging the strengths of deeper, more advanced architectures. Therefore, based on these results, we explored hybrid models Xception and Inception-ResNetV2 to enhance detection accuracy and generalization capability, especially under varying image conditions and class distributions.
Evaluation on validation and test sets
A comprehensive evaluation was performed using multiple performance metrics and visualizations to assess the generalization and reliability of both models.
Classification reports
For both the validation and test sets, the models achieved very high precision, recall, and F1-scores (around 0.98) for both the “Parasitized” and “Uninfected” classes. Overall accuracies were approximately 98% for both architectures. This indicates that regardless of the underlying base architecture whether Xception or Inception-ResNet V2, each model is highly effective at distinguishing between the two diagnostic classes indicated in Table 4.
Confusion matrices
The confusion matrices for both models reveal that the vast majority of images were correctly classified. Figure 5 shows the confusion Matrix for Xception and Inception-Resnet V2 Model. In both cases, the off-diagonal elements (indicating misclassifications) are minimal. For instance, in the validation set, only a small number of parasitized images were incorrectly classified as uninfected and vice versa. Such results underscore the robustness of both models in practical diagnostic scenarios.

Confusion matrices for validation and test sets using Xception (left) and Inception-ResNetV2 (right) models.
ROC and precision-recall curves
Both the Receiver Operating Characteristic (ROC) curves and Precision-Recall curves exhibited near-perfect shapes, with an Area Under the Curve (AUC) of 1.00 for both metrics. Figure 6 shows the validation ROC Curve for Xception and Inception Resnet V2 Model. This indicates that both models maintained high sensitivity and specificity across various threshold settings. Figure 7 shows the validation Precision-Recall Curve for Xception Based and Inception Resnet V2 Model. The almost ideal ROC and precision-recall curves suggest that both models are equally adept at minimizing false positives and false negatives, which is critical in medical diagnostics41. Figure 8 shows Test ROC Curve for Xception and Inception-Resnet V2 Model and Fig. 9 shows Test ROC Curve for Xception and Inception Resnet V2 Model.

Validation ROC curve for Xception and Inception-Resnet V2 model.

Validation precision-recall curve for Xception and Inception-Resnet V2 model.

Test ROC curve for Xception and Inception-Resnet V2 model.

Test ROC curve for Xception based model and Inception-Resnet V2 model.
Batch accuracy distribution
Box plots displaying per-batch accuracies for both models showed that the median accuracy consistently approached 0.99 with minimal variability across batches. Figure 10 shows the validation batch accuracy for Xception and Inception-Resnet V2 Model. Figure 11 shows the test batch accuracy for Xception and Inception-Resnet V2 Model. Although a few outlier batches (with accuracies around 0.92–0.94) were observed, these were rare and likely attributable to challenging or a typical image. Overall, the high consistency in batch accuracy demonstrates that both models deliver stable performance across different subsets of the data.

Validation batch accuracy for Xception based model and Inception Resnet V2 model.
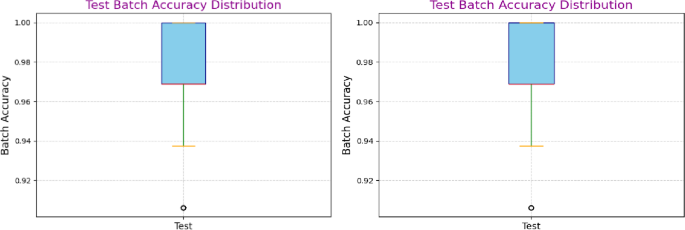
Test batch accuracy for Xception based model and Inception Resnet V2 model.
Feature visualization via dimensionality reduction
High-dimensional features were extracted from the penultimate Dense (1024) layer of each model and subsequently reduced to two dimensions using Principal Component Analysis (PCA) and t-Distributed Stochastic Neighbor Embedding (t-SNE). These visualizations help validate the discriminative power of the learned feature representations.
PCA plots
The PCA plots for both models shown in Fig. 12 revealed clear, linearly separable clusters corresponding to the two classes. In the PCA projection, images of “Parasitized” samples clustered distinctly from those of “Uninfected” samples. This linear separability indicates that the features extracted by both the Xception-based and the Inception-ResNet V2–based models are highly discriminative. Notably, despite the architectural differences, both models showed similar clustering patterns, suggesting that each model is effectively capturing the key differences in the image data.

Principal Component Analysis (PCA) Visualization of Validation Features for Xception-Based Model (Left) and Inception-ResNetV2 Model (Right). The plots illustrate the separability of parasitized (red) and uninfected (blue) classes in the feature space extracted by the two models. Clear clustering along the principal components confirms effective feature learning, with both models achieving strong class distinction and minimal overlap, supporting their high classification performance.
t-SNE
The t-SNE visualizations shown in Fig. 13 provided a more nuanced, non-linear perspective on the high-dimensional feature space. In both cases, t-SNE revealed well-defined clusters with a clear boundary between parasitized and uninfected samples. The non-linear embedding further confirms that the models’ learned representations preserve local neighborhood relationships and are organized in a manner that enhances class separability. While both models yielded similar clustering, slight differences in the density and spread of the clusters may reflect subtle variations in how each architecture encodes the features, potentially offering insights into the model-specific characteristics that contribute to their classification performance.

t-SNE Visualization of Validation Features for Xception-Based Model (Left) and Inception-ResNetV2 Model (Right). The figure demonstrates class-wise distribution using t-distributed Stochastic Neighbor Embedding (t-SNE). Distinct clusters for parasitized (red) and uninfected (blue) samples reflect the models’ ability to learn discriminative features. The Inception-ResNetV2 model shows slightly better separation, indicating more robust feature representation.
External validation on Harvard dataverse dataset
To further examine the robustness and generalizability of our proposed framework, we conducted experiments on an independent dataset obtained from the Harvard Dataverse repository42 shown in Fig. 14. Unlike the Kaggle dataset of thin blood smears, this dataset contains 2, 210 microscopy images, categorized into two classes: 1139 Thick_Infected and 1071 Thick_Uninfected 1071. This dataset provides a clinically diverse benchmark with variations in staining, image resolution, and acquisition conditions.

Representative sample images from the Harvard Dataverse thick smear dataset. The top row shows examples of Thick_Infected blood smear images, while the bottom row shows examples of Thick_Uninfected images. The dataset exhibits notable variation in staining intensity, cell morphology, and image quality, providing a diverse benchmark for evaluating the robustness of the proposed models.
Validation results
The classification report on the validation set (331 images) shows that both classes were identified with high precision and recall, yielding an overall validation accuracy of 98% with a macro-average F1-score of 0.98. The confusion matrix in Fig. 15a indicates that out of 331 validation samples, only 6 images were misclassified (1 Thick_Infected misclassified as uninfected, and 5 Thick_Uninfected misclassified as infected). This demonstrates that the model maintains strong discriminative capability even under variable imaging conditions.

Confusion matrices for the Harvard Dataverse dataset: (a) validation set (331 images) and (b) test set (332 images). The matrices demonstrate high classification performance, with only a small number of misclassifications in both sets, confirming the model’s strong discriminative ability across diverse imaging conditions.
To highlight the performance of our proposed methodology, Table 5 summarizes the validation and test accuracies of the Xception and Inception-ResNetV2 models across the Kaggle and Harvard Dataverse datasets. Both models achieved consistently high accuracies, ranging from 97.5% to 97.8%, with only marginal variation between datasets. These results confirm the robustness and generalizability of our framework under different imaging conditions.
Test results
On the independent test set (332 images), the model achieved a classification accuracy of 97%, with balanced performance across both classes. The confusion matrix Fig. 15b further validates this performance, with only 9 misclassifications out of 332 images (5 Thick_Infected → misclassified as uninfected; 4 Thick_Uninfected → misclassified as infected). The near-equal precision (0.97), recall (0.97–0.98), and F1-scores (0.97) highlight the consistency of the proposed pipeline when applied to a dataset markedly different from the training domain.
Discussion of external validation
The results confirm that the proposed methodology, combining transfer learning with two-phase fine-tuning generalizes effectively across different malaria datasets. The minimal drop in accuracy from ~ 98% (Kaggle dataset) to ~ 97–98% (Harvard Dataverse dataset) highlights the stability and reliability of the models under diverse imaging conditions. Importantly, the confusion matrices reveal that the misclassifications were balanced between the two classes, further indicating the absence of systematic bias toward one class. These findings strengthen the claim that the framework is robust and clinically relevant beyond a single dataset.
Comparison results
To place our findings in context, we compared the performance of the proposed models with recent state-of-the-art approaches for malaria parasite classification, as summarized in Table 6. Previous CNN-based methods, such as VGG19, ResNet50, and MobileNetV2, have reported near-perfect accuracies (95–100%) on the NIH malaria dataset22, while Rahman et al.22, achieved up to 99.3% accuracy on the BBBC041v1 dataset, though such values raise concerns of potential overfitting due to limited external validation. More recent studies, such as Ramakrishnan et al.31, demonstrated ~ 98% accuracy using an ensemble transfer learning approach with Grad-CAM for interpretability, whereas Awe et al.34, applied ensemble machine learning with explainable AI techniques (LIME, SHAP, PFI) on a Nigerian clinical dataset, reporting ROC-AUC values up to 0.869 but substantially lower accuracy (~ 65%) compared to image-based approaches.
In comparison, our proposed Xception and Inception-ResNetV2 models achieved 97.6–97.8% accuracy with a macro-average F1-score of 0.98 on the Kaggle malaria dataset, while also generalizing effectively to an independent external dataset. The strong performance of our models can be attributed to the integration of advanced transfer learning architectures with a two-phase fine-tuning strategy, which enhanced feature extraction while minimizing overfitting. Additionally, systematic preprocessing and mild data augmentation further improved robustness under diverse imaging conditions, and the inclusion of tri explainability (Grad-CAM, LIME and SHAP) provides added interpretability that is often absent in prior studies.
Vision transformer (ViT) comparison
To benchmark our models against emerging transformer-based architectures, we evaluated a Vision Transformer (ViT) trained on the same malaria dataset. The ViT was implemented with patch size 16, embedding dimension 768, and 12 encoder layers, totaling ~ 86 M parameters. During training, the model achieved a peak validation accuracy of ~ 80%. However, on an independent test set, accuracy dropped drastically to 50%, with balanced precision and recall (0.50 each). This indicates that the model failed to generalize despite showing apparent learning in the training phase. By contrast, our Xception and Inception-ResNetV2 models consistently achieved ~ 98% accuracy across validation, test, and external datasets. These findings suggest that while ViTs hold promise in medical imaging, their data-hungry nature and high parameter count limit performance on relatively small and domain-specific datasets such as malaria cell images. In this context, CNN-based hybrid architectures remain more effective and reliable for robust malaria detection.
Ablation study on model design
To evaluate the contribution of individual design components, we performed an ablation analysis. First, we compared standard single-phase fine-tuning with our two-phase fine-tuning strategy. While single-phase training achieved a test accuracy of ~ 96.5%, the two-phase approach reached ~ 97.7%, confirming that progressive unfreezing of layers provides more stable convergence and reduces overfitting.