Materials
Cortisol, 17-OHP, 2,6-dichlorophenolindophenol (DCPIP), phenazine methosulfate (PMS), pyrroloquinoline quinone (PQQ), 1-ethyl-3-(3-dimethylaminopropyl)carbodiimide (EDC), N-hydroxysuccinimide (NHS) and polyethyleneimine (PEI) were purchased from Sigma-Aldrich. Compound UW154 was commercially synthesized by o2h Discovery39. NanoLuc substrate furimazine was purchased from Promega. Deuterated chemicals were purchased from Goss Scientific Instruments. The LuxSit Pro assay kit was acquired from Monod Bio (LS0101). The luciferase assay plate OptiPlate-96 HS was purchased from PerkinElmer. The synthetic peptides were purchased from Mimotopes. Biotinylated 17-OHP with a PEG linker and biotinylated cortisol with a PEG linker were synthesized by SYNthesis med chem. Biotinylated progesterone with a PEG linker was purchased from Cayman Chemical (9000645).
Molecular cloning, expression and purification of recombinant proteins
The open reading frames of the constructs listed in Supplementary Table 1 were synthesized commercially (Gene Universal) and cloned into a kanamycin-resistant pET-28a(+) vector.
Competent E. coli BL21(DE3) cells (New England Biolabs) were transformed with the resulting expression vectors and grown in Luria–Bertani (LB) broth with 50 μg ml−1 kanamycin (Everest) with shaking at 37 °C. Protein expression was induced by adding 0.3 mM IPTG (Sigma) and the cultures were incubated overnight at 18 °C. Cells were harvested at 4,000 rpm for 10 min and the cell pellet was lysed in buffer containing 50 mM Na2HPO4 (pH 8.0), 300 mM NaCl, 20 mM imidazole, 1 mM AEBSF and DNAse I (all Sigma). Following cell lysis and disruption at 27 kPsi using the CFII cell disrupter (Constant Systems), the supernatant was collected and recombinant protein was further purified on the Ni-NTA HisTrap FF crude column driven by ÄKTA Express purifier (Cytiva) system in buffer containing 50 mM Na2HPO4, 300 mM NaCl and 20 mM imidazole and a gradient of 500 mM imidazole for elution at pH 8.0. Finally, the protein was dialyzed against 20 mM Tris-HCl (pH 7.0) and 100 mM NaCl; protein aliquots were frozen in liquid nitrogen and stored at −80 °C.
Design of chimeric proteins
To design the protein chimeras, a arbitrary residue located within a loop region was chosen as the permutation site to generate the circularly permuted binder. This amino acid was removed to establish novel N and C termini. The native N and C termini of the binder were joined by a flexible glycine–serine linker of sufficient length. This permuted binder was inserted at position 253 of β-lactamase TEM-1, with a single glycine residue used as a linker between TEM-1 and the binder. The structural models of the chimeras were generated using WinCoot 0.9.8.1 and the structures of the receptor and reporter domains as inputs. The structure of TEM-1 β-lactamase (PDB 3GMW) was manually connected to the structure of the circularly permuted binders and the linker joining the native N and C termini of the binder was manually constructed. The structures of proteins and protein chimeras were visualized using ICM 3.9-4 (Molsoft).
Expression and purification of protein containing NMR probe
For the site-specific incorporation of the unnatural amino acid p-(O)CF3-tyrosine, E. coli B-95.ΔAΔfabR cells40 (Addgene, 197934) were cotransformed with pRSF-G1-pCNPRS (Addgene, 174719) and the pCDF plasmids (Gene Universal) carrying the gene of the target with amber codon placed at the desired position. The cells were grown in LB medium (Sigma) supplemented with 25 mg L−1 kanamycin (Everest) and 25 mg L−1 spectinomycin at 37 °C until reaching an optical density of 0.4–0.6, followed by the addition of p-(O)CF3-tyrosine (Ambeed) to the final concentration of 2 mM. After 30 min of continuous shaking, IPTG (Sigma) was added to a final concentration of 0.5 mM to induce protein expression and the culture was grown overnight at 18 °C. The recombinant protein was purified by Ni-NTA chromatography using a HisTrap FF crude column driven by an ÄKTA Pure Purifier (Cytiva) system as described above.
19F-NMR spectroscopy
19F-NMR spectra were recorded using protein samples at 0.40–0.85 mM concentration dissolved in 90% H2O/10% D2O, 20 mM Tris-HCl pH 7.2 and 100 mM NaCl and placed in 5-mm NMR tubes. The ligand 17-OHP was added from a 100 mM stock solution in DMSO at a final concentration of 1.5 mM. 19F-NMR spectra were recorded at 25 °C without 1H decoupling on a Bruker 400-MHz NMR spectrometer equipped with a broadband probe. The following parameters were used: acquisition time, 180 ms; recovery delay, 1 s; exponential window multiplication with line broadening by 15–40 Hz (depending on the natural line width) before Fourier transformation. The total recording times of the NMR spectra ranged between 0.5 and 1 h. Inversion–recovery experiments determined T1 relaxation times of about 0.6 s.
Design of small-molecule-binding proteins
De novo proteins binding cortisol and 17-OHP were designed as previously described17. Protein backbone scaffolds were generated using a hallucination method based on trRosetta to generate diverse structures with NTF2-like topology. Cortisol and 17-OHP were docked onto these scaffolds using RIFdock and protein sequences were subsequently designed with either using Rosetta or LigandMPNN41. The resulting ligand–protein complexes were evaluated using Rosetta scoring functions and AlphaFold2 predictions. Selected subsets of sequences were experimentally tested for binding characterization and representative binders were then chosen for the construction of chimeric sensor proteins.
Design and construction of C-peptide binding domain
CPH02 was optimized from the construct CPS_1b2 in the previous work42. Here, full length C-peptide was remodeled with the designed binder instead of a short middle region. The ProteinMPNN-fastrelax43 cycle was carried out twice to refine the interface toward the new dock, with arginine and lysine downweighted by −0.15. Ten new sequences were generated and the top design with the best AlphaFold2 metrics42 was selected, characterized biophysically and used for biosensor design.
ELISA assay
To achieve streptavidin (Sigma, S4762) immobilization on a Maxisorp plate (Thermo Fisher Scientific, 442404), the latter was incubated with 10 µg ml−1 streptavidin in PBS solution overnight at room temperature. The plate was washed three times with PBS, incubated with 2 µM biotinylated steroids for 1 h and then blocked with 2% casein in PBS for 1 h. Purified binding proteins were serially diluted in 2% casein in PBS buffer. After a 1-h incubation, the plate was washed three times with PBST (PBS with Tween-20) and incubated for 1 h with 100 µl of anti-FLAG–HRP (1:5,000; Sigma, A8592). Following PBST washes, TMB substrate (Thermo Fisher, 34028) was added and the reaction was quenched with 1 M sulfuric acid when the color developed sufficiently. Absorbance at 450 nm was recorded using a Neo2 plate reader. The titration data were fitted in GraphPad Prism using its four-parameter IC50 equation and the resulting values were used as the apparent affinity estimate.
Spectrophotometric analysis of β-lactamase enzymatic activity
The enzymatic assays were performed in the assay buffer containing 20 mM Tris-HCl pH 7.2 and 100 mM NaCl at 25 °C by monitoring the increase in absorbance of UW154 (ref. 39) at 520 nm using a Cary 60 ultraviolet (UV)–visible light (Vis) absorbance spectrometer operated by Cary WinUV Software.
Spectrophotometric analysis of GDH enzymatic activity
The GDH chimera protein was reconstituted with PQQ in 1:1.5 ratio. The enzymatic assays were performed in the assay buffer containing 20 mM Tris-HCl pH 7.2, 1 mM CaCl2 and 100 mM NaCl in the presence of 60 μM electron-accepting dye DCPIP, 0.6 mM electron mediator MPS and 20 mM glucose at 25 °C by monitoring the decrease in absorbance at 600 nm using a Cary 60 UV–Vis absorbance spectrometer operated by Cary WinUV Software.
Analysis of NanoLuc enzymatic activity
The assay was performed in 96-well plates (OptiPlate-96 HS, PerkinElmer). The luminescence was recorded at 445–470 nm by a TECAN plater reader after mixing 200 μl of a solution containing 20 mM Tris-HCl pH 7.2, 100 mM NaCl and 0.25 μl of the NanoLuc substrate and NanoLuc chimera protein.
Analysis of NanoLuc and LuxSit Pro enzymatic activity
The enzymatic assay of NanoLuc and LuxSit were performed in 200 µl of buffer containing 20 mM Tris-HCl pH 7.2 and 100 mM NaCl or the supplied assay buffer from LuxSit Pro luciferase assay system, respectively. The protein sensors were first incubated at 25 °C for 30 min with corresponding ligands. Upon addition of 0.2 µl of substrate (NanoLuc, Promega) or 2 µl of substrate (LuxSit Pro substrate, Monod Bio), the change in luminescence signal at 445–470 or 475–500 nm, respectively, was monitored with a TECAN plater reader (SPARK).
Activity analysis of β-lactamase calmodulin chimera library in the presence of different CaM-BPs
A set of 17 genes encoding β-lactamase–CaM chimeras were synthesized and named on the basis of the residue in β-lactamase where the CaM domain was inserted (Supplementary Table 1). The chimeras were recombinantly produced in E. coli and their activity was tested in the presence of 29 CaM-BPs to evaluate the effects of both insertion site and ligand peptide on biosensor function using a 96-well plate assay format. The purified β-lactamase–CaM proteins were prepared at a final concentration of 10 nM in a reaction buffer containing 20 mM Tris-HCl pH 7.2 and 100 mM NaCl. Enzymatic activity was assessed for each variant in both the presence and the absence of 1 µM CaM-BPs. Following peptide addition, the biosensor–peptide mixtures were incubated at room temperature for 20 min. To ensure simultaneous reaction initiation, 50 µM nitrocefin was added to each well of the 96-well plate using the Rainin Liquidator 96 manual pipetting system. Absorbance of the solution at 486 nm was continuously recorded every 10–20 s at 25 °C using a Synergy Neo2 microplate reader (BioTek) until the signal stabilized.
Quantification of biosensor performance parameters and data plotting
To determine the dynamic range of the individual switches, we used ligand titration experiments to establish the Kd value for the ligand. We then performed the assay either at zero or saturating concentration of the ligand (typically 20-fold greater than the Kd value) and recorded the absorbance change trace. The linear phase of the trace was fitted to the linear function defined as the observed rate constant (kobs). The dynamic range was calculated by dividing the kobs of the background signal in the absence of the ligand by the kobs recorded at saturating ligand concentration.
To determine the biosensor’s latency, the switches were incubated with their cognate ligands for the time period indicated and assayed for enzymatic activity. The initial rates were determined and the activation rate was calculated by fitting the data to a single exponential.
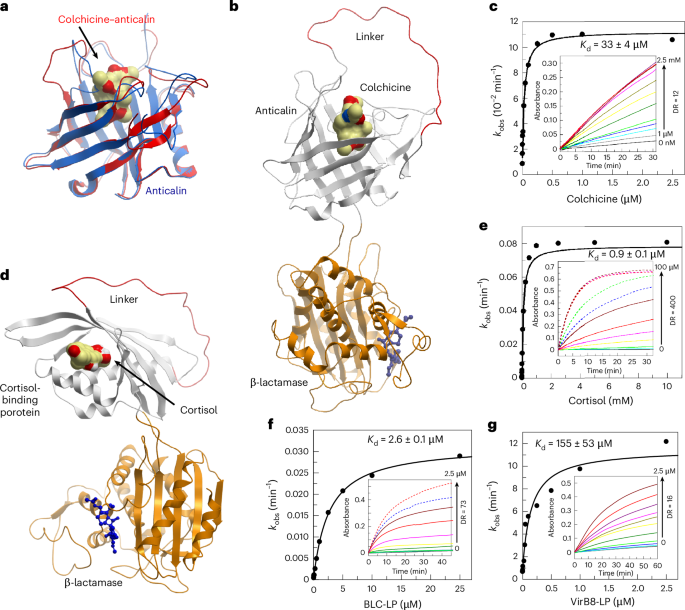
To determine the affinity of the biosensors for their targets, the linear phase of the curves recorded at different concentrations of the ligand was fitted as a linear function to obtain kobs. The mean kobs was obtained by averaging three independent experimental data. To obtain the Kd for the interaction of biosensors with their ligand, the kobs data were plotted against the concentration of the ligand and the data were fitted to the explicit solution of equation 1 describing the E + S < > ES binding equilibrium, where Kd is defined as Kd = [E] × [S]/[EL]. [E0] and [L0] refer to the total enzyme and ligand concentration (free and bound) in the cuvette. Under these conditions, kobs can be expressed as follows:
$$\begin{array}{l}{k}_{\rm{obs}}={k}_{{\rm{obs}}(\min)}+({k}_{{\rm{obs}}(\max)}-{k}_{{\mathrm{obs}}(\min)})\times \left(([{\rm{E}}_{0}]+[{\rm{L}}_{0}]+{K}_{{\rm{d}}})/2 \right.\\ \qquad{-{([{\rm{E}}_{0}]+[{\rm{L}}_{0}]+{K}_{{\rm{d}}})}^{2}/4-[{\rm{E}}_{0}]\times\left. [{\rm{L}}_{0}]\right)}^{1/2}/[{\rm{L}}_{0}]\end{array}$$
(1)
where kobs represents the measured rate, and kobs(min) and kobs(max) refer to the minimal and maximal rates observed, respectively. A least-squares fit of the data to equation 1 using the software package Grafit 5.04 (Erithacus software) was used to extract the Kd value and its s.d.
In competitive titrations aimed at determination of the Kd values for 17-OHP interaction with OHPFA1952 or cpOHPFA1952-20, the mean kobs values from three independent experiments were fitted to a competitive model using GraphPad Prism 10.4.1. In this process, we used the one-site fit inhibition constant (Ki) model and fixed the Kd of cpOHPFA1952-20-BLA-253 interaction with 17-OHP to the value obtained in direct titration of cpOHPFA1952-20-BLA-253 with 17-OHP.
The bars in the bar graphs shown in Figs. 3 and 4 represent values of an average of three independent measurements performed as a part of the same experimental set. The error bars denote positive and negative boundaries of the s.e.m.
Construction of expression vectors for in vivo activity analysis of β-lactamase and bacterial survival assays
The constructs carrying β-lactamase chimeras with a constitutive promotor based on a modified pACYCDuet-1 vector were created. The inducible T7 promotor in the original pACYCDuet-1 vector was replaced by the constitutive AmpR promotor (Supplementary Table 1).
Thermostability analysis of the β-lactamase-based biosensor
We incubated the β-lactamase-based switches in triplicates at different temperatures before the activity assay. The incubation times and temperatures were as follows: 4 °C for 3 h, 25 °C for 3 h, 37 °C for 1 h, 50 °C for 30 min, 50 °C for 10 min and 80 °C for 10 min.
CD spectrum recording
CD spectra were measured using a J-1500 Spectropolarimeter (Jasco) within the wavelength range of 194–260 nm. Data were collected at 0.1-nm intervals with a path length of 1 mm and a scanning speed of 50 nm min−1. The experiments were conducted in triplicate using protein samples prepared in a buffer containing 10 mM Tris-H2SO4 pH 7.2 and 20 mM NaCl with or without the ligand. The concentrations of both the protein and the ligand used in the assays are detailed in the respective figure legends.
Biolayer interferometry
Binding kinetics were measured on an Octet RED968 system (ForteBio) at 25 °C using streptavidin biosensors. Sensors were preequilibrated in assay buffer (PBS, 0.05% Tween-80 and 0.1% BSA) before ligand loading. A biotinylated 17-OHP derivative (200 nM) was immobilized to a loading response of ~0.35 nm, followed by baseline stabilization in assay buffer.
Association was measured by dipping sensors into wells containing wild-type OHPFA1952 17-OHP-binding domain or the circularly permuted variant cpOHPFA1952-20 at 400, 200, 100 and 0 nM. After 300 s of association, sensors were transferred into buffer-only wells to monitor dissociation for 300 s. Reference sensors (ligand-loaded, buffer only) were included to subtract background.
Data were reference-subtracted, aligned and globally fitted to a 1:1 binding model using ForteBio Data Analysis 9.0 to obtain association (kon) and dissociation (koff) rate constants, as well as the equilibrium dissociation constant (Kd).
ITC
ITC experiments were performed on a MicroCal PEAQ-ITC (Malvern) at 25 °C. Proteins were dialyzed extensively against assay buffer (20 mM Tris-HCl pH 7.2 and 100 mM NaCl). Protein concentrations were determined spectrophotometrically using calculated extinction coefficients. 17-OHP was dissolved in DMSO (20 mM) and diluted to 50 µM in the same buffer.
The sample cell (200 µl) was loaded with 50 µM 17-OHP and the syringe (40 µl) contained 500 µM wild-type OHPFA1952 or cpOHPFA1952-20. Each titration consisted of an initial 0.4-µl injection followed by 19 sequential 2-µl injections, with a reference power of 10 µcal s−1 and stirring at 750 rpm. Control titrations of protein into buffer were performed to correct for dilution heats.
Raw thermograms were integrated, corrected for heats of dilution and fitted to a one-site binding model using the MicroCal PEAQ-ITC analysis software. Thermodynamic parameters including Kd, enthalpy (ΔH), entropy contribution (–TΔS) and Gibbs free energy (ΔG) were derived from the fits.
Preparation of bioelectrodes functionalized with 17-OHP-GDH biosensor
Carbon paper composed of carbon fibers (SpectracarbTM 2050 L-1050, Fuel Cell Store) was used as the core electrode material. To increase the sensitivity of the bioelectrode, the carbon fibers were decorated with graphene nanosheets using four cycles of cyclic voltammetry in the range of −0.5 to +3.0 V, with a potential scan rate of 50 mV s−1 for four successive cycles in 25 mM phosphate buffer pH 6.9 while stirring at 400 rpm. The electrodes were treated in chronoamperometric mode at +1.0 V for 120 s in the same solution and conditions44. 17-OHP-GDH was immobilized on the graphene nanosheets modified surface by first treating the electrode surface with PEI water solution (20 mg ml−1) for 1.5 h while moderately shaking. The PEI-functionalized electrodes were rigorously washed twice with 25 mM HEPES pH 7.6. Subsequently, the electrodes were incubated for 2 h with slow shaking in the dark in a solution of 50 mM EDC, 50 mM NHS, 1 µM 17-OHP-GDH and 25 mM HEPES, pH 7.6. The formed bioelectrodes were washed out twice with 25 mM HEPES pH 7.6 before usage. The bioelectrodes were analyzed by cyclic voltammetry scanned at a rate of 5 mV s−1 versus the Ag/AgCl/3 M KCl reference.
Electrode characterization
The constructed bioelectrodes were shown to provide the maximal output at saturating substrate concentration (Imax) of 22.5 ± 0.01 µA with a limit of detection (3σ) below 0.5 nM. We determined the apparent Michaelis–Menten constant for 17-OHP (Kmapp) as 34.5 ± 0.01 nM. The biosensor sensitivity was determined as 4583 µA mM−1 cm−2 calculated from the slope taken of the linear phase of the binding curve (330 ± 40 µA mM−1) divided by electrode working surface area (6 × 6 mm (both sides) = 0.072 cm2).
Scanning electron microscopy of electrodes
The scanning electron microscopy (SEM) imaging of bioelectrode surfaces was conducted using a JSM 7900F field-emission SEM instrument (JEOL). Before SEM analysis, the electrode was treated with liquid nitrogen and freeze-dried overnight. The freeze-dried electrode surface was then fixed by a Butvar solution B-98 (Sigma) in 1.5% chloroform. The applied accelerator voltage was 5.0 kV with magnification ranges from ×3,000 to ×10,000.
HDX–MS of biosensor proteins
HDX was performed using fully automated, millisecond HDX labeling and automated online quench-flow fast HDX instrument, ms2min (Applied Photophysics, part of Nicoya Lifesciences), connected to an HDX manager (Waters) directly coupled to a Synapt G2-si mass spectrometer (Waters). Next, 10 µl of apo protein (10 µM) or protein equilibrated with 20 µM 17-OHP (1:2 molar ratio) in formulation buffer (20 mM Tris-HCl and 100 mM NaCl, pH 7.20) was mixed with deuterated labeling buffer (20 mM Tris-HCl, 100 mM NaCl, pHread 6.79, pD 7.20) in a 1:20 ratio at 23 °C to initiate HDX, incubated for mixing times of 100–100 000 ms, then mixed with quench buffer (1 M glycine and 3 M urea, pH 2.45) in a 1:1 ratio at 0 °C and automatically injected into the two-dimensional liquid chromatography–MS system. The sample was digested with an Enzymate pepsin column (Waters), the derived peptides trapped on a VanGuard ACQUITY BEH C18 column (2.1 × 5 mm; Waters) for 3 min at 125 µl min−1 and separated on an ACQUITY BEH 1.7-μm C18 column (1 × 100 mm; Waters) with a 7-min linear gradient of acetonitrile (5–40%) supplemented with 0.1% formic acid. Mass spectra were acquired in positive ion resolution mode with ion mobility from 300 to 2,000 m/z. The ProteinLynx Global Server 2.5.1 (Waters) was used for spectral assignment of MSE reference data to identify peptides. DynamX 3.0 (Waters) was used to process and assign isotopic distributions of raw data files for HDX experiments. All HDX–MS experiments were performed in triplicate (technical replicates). Statistical analysis was performed by calculating hybrid significance with global significance thresholding and Welch’s t-test, essentially as previously described45. Structural models were made using ICM 3.9-4 (Molsoft).
MD simulations
Amber22 was used for all MD simulations46. Construction of chimera’s structures for the simulations is described above. Hydrogens were added to 17-OHP in the holo structure and 17-OPH was deleted to provide the apo structure for molecule dynamics. 17-OHP was parameterized with the GAFF2 force field with Mulliken charges using the Antechamber module of Amber22 (ref. 47). All simulations were performed in triplicate using the Generalized Born (GB-Neck2) implicit solvent model (igb = 5). Initial energy minimizations entailed 25,000 steps of steepest descent and 25,000 of conjugate gradient with default gradient cutoffs, using random seeds and no positional restraints. These were followed by 2.2 µs of MD simulation collected in batches of 100 ns for each replicate at 300 K using 2-fs timesteps and SHAKE constraints. Frames were collected every 5,000 timesteps and the first 100 ns of each trajectory was discarded, providing production trajectories of 210,000 frames (2.1 µs) for each replicate.
Use of AI manuscript writing
Generative AI was used at the final stages of manuscript preparation for editing parts of the manuscripts for length and clarity. All changes were verified by the corresponding author.
Reporting summary
Further information on research design is available in the Nature Portfolio Reporting Summary linked to this article.