Multi-horizon price prediction indicator powered by random forest ribs — The first open source random forest library for Pine Script. This indicator shows how to build, train, and deploy a regression-based ensemble model entirely within a Pine script to generate future price predictions with statistically grounded prediction intervals.
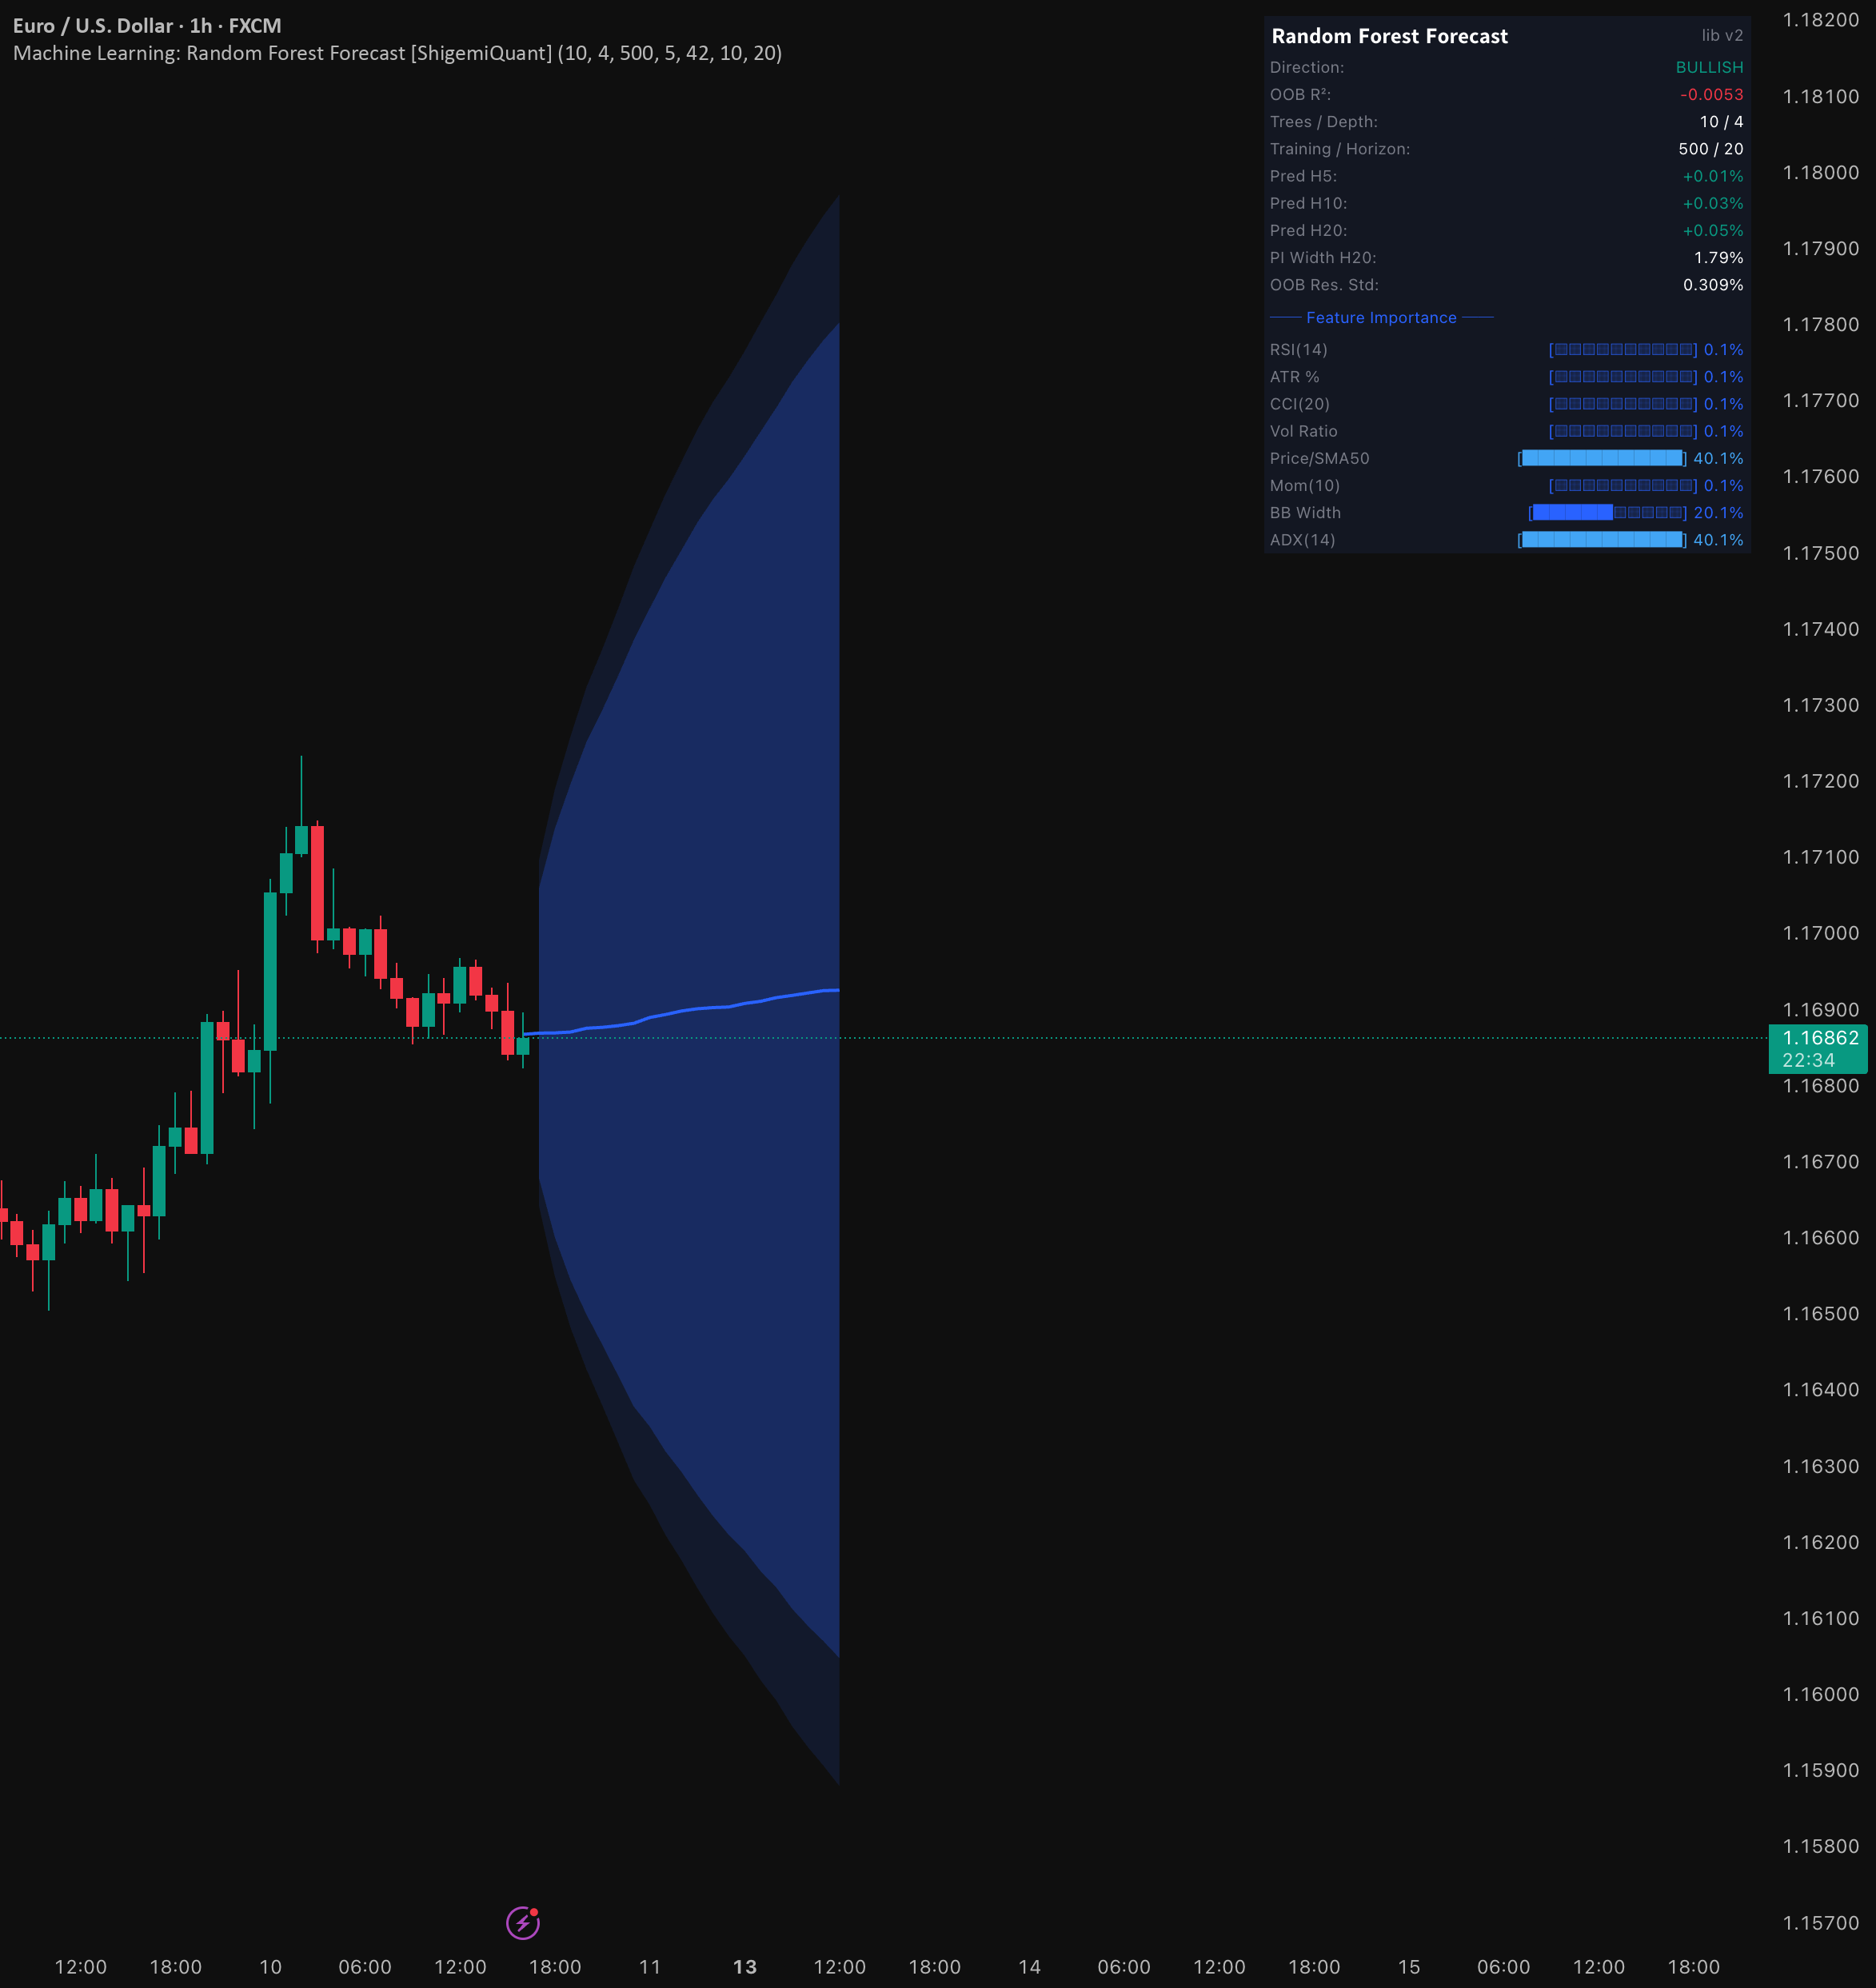
The model simultaneously predicts the percentage of price change for the next 1 to 20 bars and draws the prediction path as a line with fan-shaped 90% and 95% prediction intervals that naturally widen over time.
━━ Features (8 inputs) ━━
This model uses eight engineered technical features:
- RSI(14) — relative strength index
- ATR% — ATR(14) percentage of price
- CCI(20) — Commodity Channel Index
- Volume ratio — volume to 20 bar SMA
- Price/SMA50 — Price position (%) relative to the 50-bar SMA
- Momentum(10) — rate of price change over 10 bars
- BB width% — Bollinger band width as a percentage of basis
- ADX(14) — average directional index
━━ Multi-horizon forecast ━━
Unlike single-step models that only predict the next bar, this indicator trains separate regression targets for each period (H1 to H20). Each period predicts the percentage change in price from the current bar to N bars ahead. The result is a complete forward price trajectory. This is a complete prediction path rendered as a polyline on the chart, rather than a single point estimate.
━━ Prediction interval (OOB residual method) ━━
The prediction interval is calculated using: Out-of-bag residue method (Wager et al., 2014). During training, the OOB prediction error for each sample is recorded. The standard deviation of these residuals is calculated separately for each period and provides a calibrated measure of forecast uncertainty.
- 90% P.I. — ±1.645 × OOB residual standard deviation
- 95% P.I. — ±1.960 × OOB residual standard deviation
The residual variance naturally increases with longer periods, so the forecast intervals form a sector. It narrows in H1 and gradually widens in H10, H15, and H20. This accurately reflects the growing uncertainty in long-term forecasts.
━━ No-repainting design ━━
All training and inference is performed exclusively [code]barstate.island[/code]. The model is rebuilt from scratch on the last bar using historical data to ensure that the predictions are accurate. never redraw. What you see on the chart is the same as what you see in real time.
━━ Dashboard ━━
A comprehensive dashboard shows:
- direction — Forecast direction (bullish/bearish) based on forecast sign
- OOB R² — Out-of-Bag R-squared (Goodness of Fit) — Colored green if positive
- trees / depth — Current ensemble composition
- Training / Horizon — Number of training bars and prediction period
- Pred H5/H10/H20 — Projected percent change at horizons 5, 10, and 20
- PI width H20 — total width of the 90% prediction interval at the farthest horizon
- OOB resolution standard — OOB residual standard deviation (average over range)
- Importance of functionality — Weighted Gini reduction for all eight features. Displayed as a Unicode bar graph with the most important features highlighted.
━━ Parameter ━━
- number of trees (default 10) — Ensemble size (1-15)
- maximum depth (default 4) — Maximum tree depth (1-6)
- training bar (default 500) — history bar used for training (100-1000)
- Threshold candidate (default 5) — number of split thresholds (3 to 10) evaluated per feature
- random seed (default 42) — seed for reproducible results
- Minimum number of samples per leaf (default 10) — minimum number of samples required for each leaf node (5-50)
- prediction horizon (default 20) — number of bars to predict ahead (5 to 30)
- Show 90% PI (default true) — toggle 90% prediction interval band
- Show 95% PI (default true) — toggle 95% prediction interval band
- Prediction line color — Predicted polyline color
- 90% PI Color / 95% PI Color — Prediction interval band color
- View dashboard (default true) — toggle analytics dashboard
━━ How it works ━━
1. data collection — Eight technical features are calculated for each bar with valid data and accumulated in a feature matrix.
2. Multi-target label generation — For each training bar, the percentage price change from horizon 1 to N is calculated and stored as a multi-column target matrix.
3. training — Random forest ensembles are constructed using bootstrap sampling. Each tree learns to predict all horizons simultaneously. OOB residuals are recorded for adjustment of prediction intervals.
4. inference — The trained model averages the predictions across all trees to predict the trajectory of price changes from horizon 1 to N.
5. visualization — The forecast is rendered as a polyline extending from the current bar with a sector-shaped 90%/95% forecast interval band.
━━ Library ━━
This indicator is built on random forest ribs — A general purpose random forest library for Pine scripts with scikit-learn compatible API. This library supports both classification and regression, including multi-horizon prediction and OOB-based prediction intervals. You can use the same library to build your own ML-powered indicators and strategies. Please see profile for library page.
━━ References ━━
- Bryman, L. (2001). random forest. Machine Learning, 45(1), 5–32.
- Wager, S., Hastie, T., and Efron, B. (2014). Confidence interval for random forest. Machine Learning Research Journal, 15, 1625-1651.
━━ Disclaimer ━━
This indicator is provided for For educational and research purposes only. It’s not financial advice. Machine learning models can and do produce inaccurate predictions. Past performance does not guarantee future results. Always conduct your own analysis before making any trading decisions.