
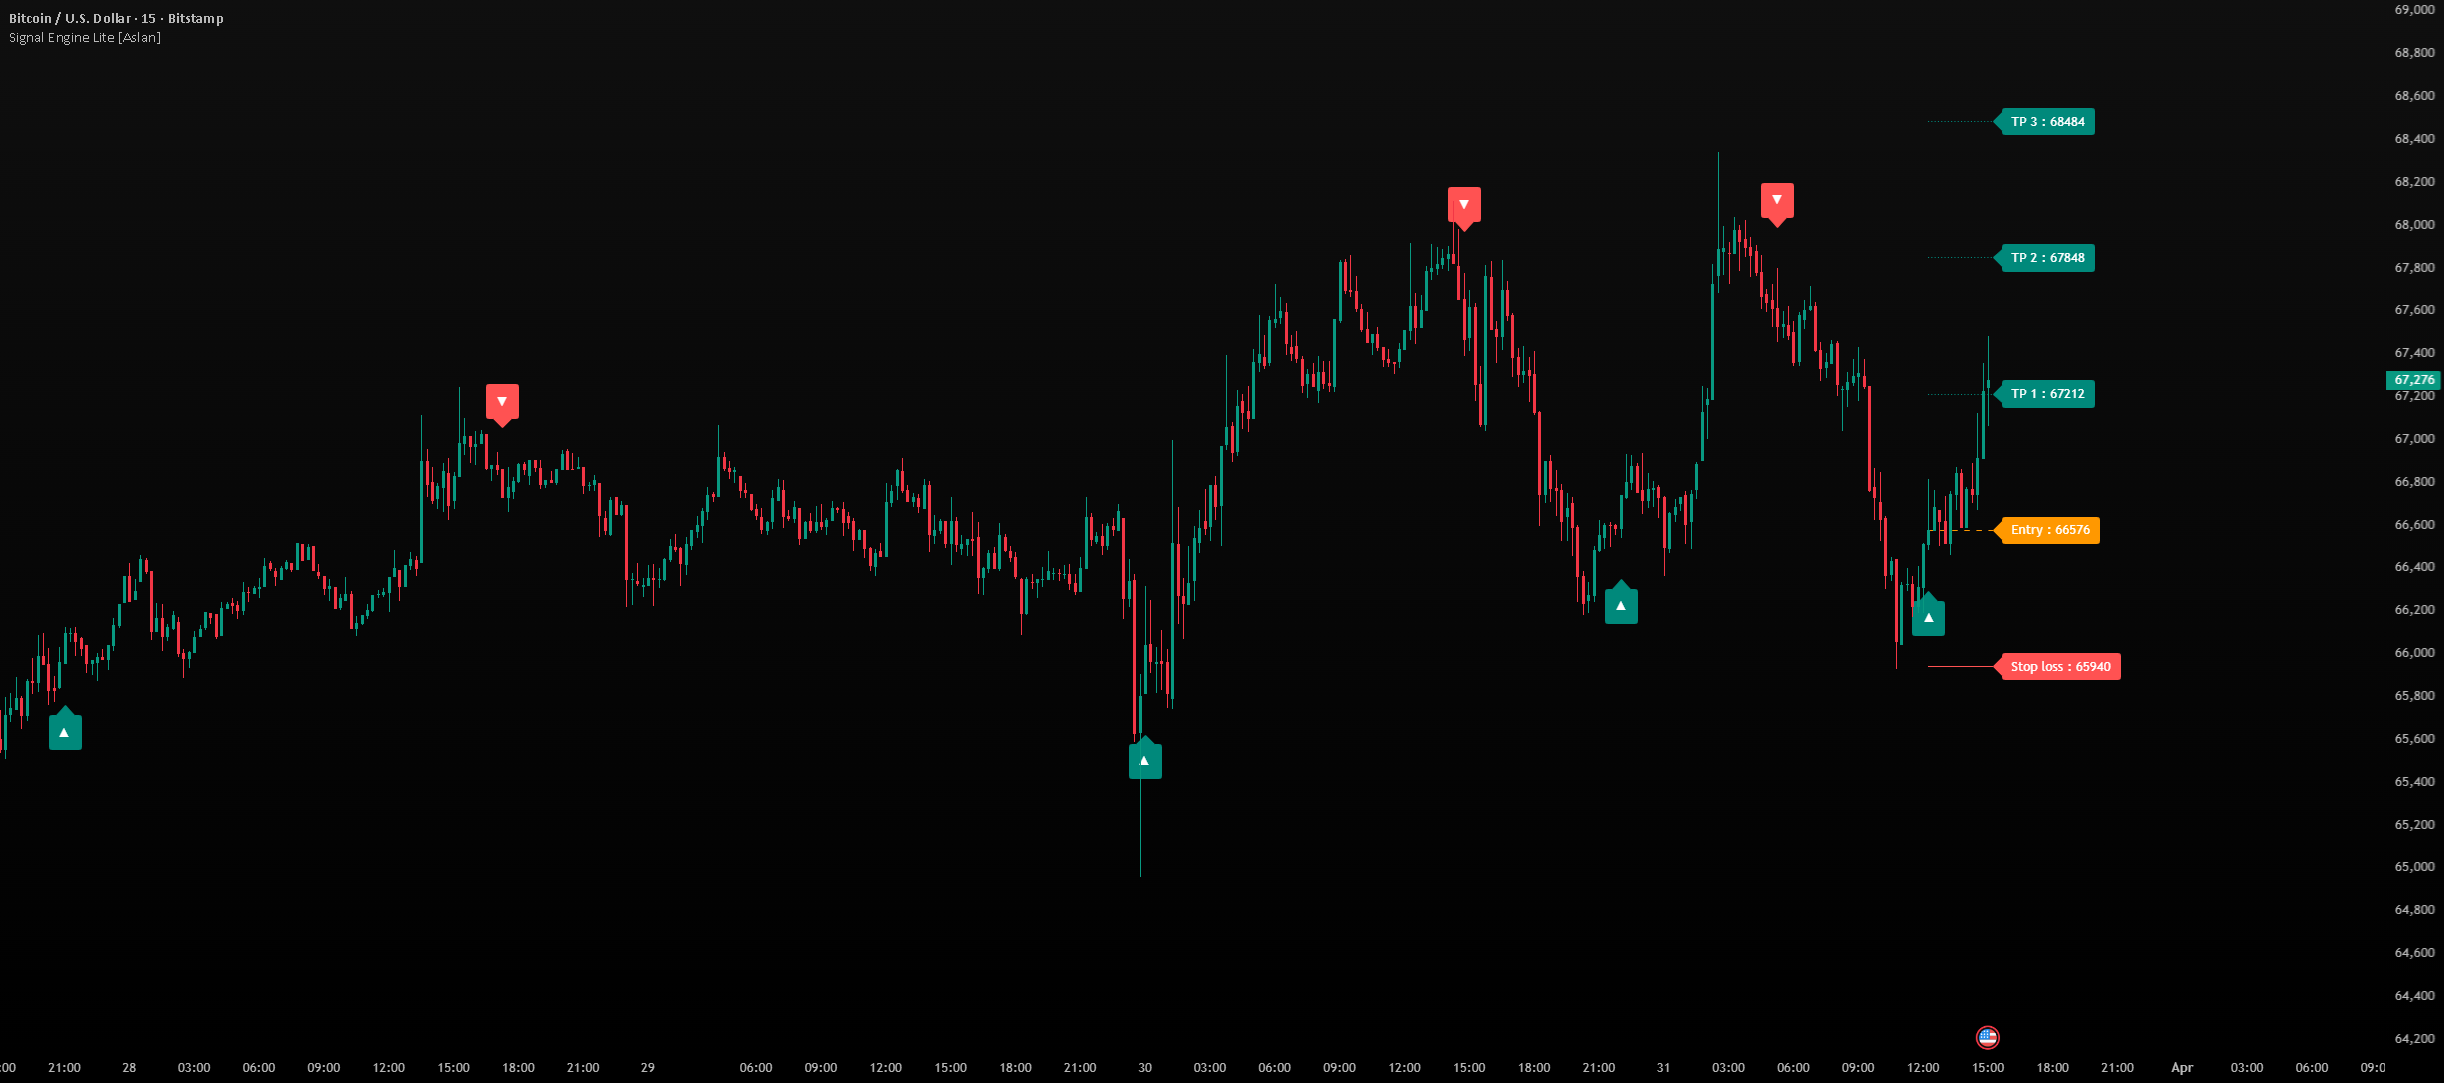
It uses the SuperTrend foundation layer with momentum filtering, volume checking, and most importantly, an adaptive engine that continuously adjusts its own parameters based on recent performance. Fire entry arrows on the chart and silently adjust over time while running a background simulation to score the performance of your current settings.
Two systems run in parallel. A signal engine that generates the displayed arrows and a background test matrix that opens and closes simulated trades to feed the optimizer. The optimizer adjusts parameters to generate better signals and feed back for better learning.
core concept
Essentially, this is a supertrend indicator, a volatility band that flips bullishly or bearishly when the price crosses it. Signals occur when a reversal occurs (reversal mode) or when the price reaches a new extreme within the current trend (breakout mode).
In addition to this, three adaptive learning layers run continuously.
global optimizer — Rolling window of recent trading results that suggests parameter changes based on win percentage, Sortino ratio, and profit factor
micro batch processor — Fast layer that groups results into mini-batches for faster adjustments
regime grid — 2D memory map that remembers what settings worked under similar market conditions (trend strength x volatility) and biases recommendations accordingly
The most important settings — start here
Band width (Group ②) — Default: 1.4
The most influential single setting of the entire indicator. Controls the width of the SuperTrend band. Lower values (1.0 to 1.2) create tight bands with frequent flips, giving you more signal but also more noise. Higher values (2.0 to 3.0) will only reverse on large tectonic movements, resulting in fewer but stronger signals. If you feel your charts are too noisy, turn this up first. The higher the value, the more trend-following signals; the lower the value, the more contrarian signals.
lookback window (Group ②) — Default: 30
The number of bars the indicator scans when detecting new highs and lows. Low values (10-15) respond to small shakes and fire frequently. Higher values (50-100) only respond to large structural pivots. Adjust this to match your bandwidth. These work together.
Signal type (Group ①) — Default: Inverted
Choose one and stick with it. A reversal captures a turning point when a trend dries up. The breakout rides the momentum to new extremes.
Reactivity/Master Dial (Group ⑥) — Default: 10
Controls how aggressively the adaptation engine reacts to new information. Value 1 = very conservative, adapts slowly and stays close to the base input. Value 20 = aggressive, adapts quickly, and can deviate significantly from basic settings. Start at 10 and increase only if the nature of the market you are trading changes frequently.
signal interval (Group ①) — Default: 10
Minimum bar between any two signals. Prevents intensive rapid-fire penetration in choppy zones. It is lower on fast time frames (3-5 on 1-minute charts) and higher on daily charts (20-30).
Reference by group
①Signal mode
Signal type — A reversal captures a depletion reversal in a trend. The breakout rides the momentum to new extremes. Please choose one.
need new pivot — If on, the signal will only fire if the price first creates a true new high/low. Off = more signal and more noise.
signal interval — Minimum bar between signals. Adjust by time frame.
②Volatility envelope
lookback window — Bars scanned for new highs/lows. Low = more responsive, more signal.
Smoothing period — ATR calculation period. Lower = faster reaction to volatility and more band flips.
Band width — Bandwidth ATR multiplier. The most influential settings within the indicator. Low = more signal, high = less strong signal.
price base — Which price sources feed into SuperTrend. hlcc4 (default) is the smoothest and close is the most responsive.
true range mode — On = RMA smoothed ATR (standard). Off = smoothed with EMA, faster but noisier.
③Momentum filter
active — Toggle RSI filtering. Off = signal increases, but no momentum is observed.
length — RSI period. Lower = more fluctuations in RSI and filters are more easily triggered.
hot zone memory — Number of bars to check if RSI is overbought (for sell confirmation). Higher = more generous.
cold zone memory — Same concept for oversold/buy confirmation.
RSI hot/cold level (Set in group ⑬) — Overbought/oversold threshold. Default is 70/30. Wider = more signals, narrower = less.
④ Flow analysis
sample depth — Bars averaged to define “normal” volume.
surge threshold — To count as a surge, trading volume must exceed this multiple of the average (1.2 = 20% above the average).
need surge — If on, the signal fires only on volume confirmation. Counts are significantly reduced, but quality is greatly improved. It’s worth enabling.
⑤ Signal quality
key level only — Signals fire only at major tectonic turning points. Fewer signals – suitable for swing traders.
key level depth — ATR must span price ranges to qualify as a major level. This is only an issue if Key Levels Only is on.
⑥Master dial
Reactivity (1-20) — Adaptive engine-wide meta-knob. Simultaneously control batch size, adaptation speed, deadband sensitivity, and EMA alpha. If you only want to change one adaptation setting, change this.
micro batch processing — Enable a fast mini-batch learning layer. On = faster adaptation.
live pressure sensor — Track cumulative up/downtick volume flow of live bars to bias optimizer step size. Affects live charts only.
⑦ Auto tune engine
Enable automatic adjustment — Master Switch. Off = parameter is permanently fixed and is just a traditional indicator.
Using the background test matrix — Run a 5×5 simulated trade grid. Must be turned on for adaptation to occur.
Lock envelope to base — Forces the plotted bands to visually use the original input, even if the internal parameters are drifting. The signal engine will always use the adapted value regardless.
⑧ Optimizer
Most users do not need to change these. The defaults work fine.
step size — Base learning rate. Higher = faster, but may overshoot adaptation.
depth of history — Rolling window of trades used to calculate statistics. High = slower but more stable learning.
window ceiling/floor — Win rate threshold that triggers parameter enhancement or relaxation.
Momentum smoothing — EMA blending factor for applying new suggestions. Higher = faster acting changes.
Update cooldown — Minimum bar between parameter updates. Prevents sudden oscillation.
Dead band width/period — The proposed change must pass these thresholds before it is applied. Filters micro-jitter.
Anchor return interval/strength — Every N bars, the parameter drifts back towards the base input. Safety mechanism against unlimited drift.
Maximum profit and loss per trade — Clip outlier trades at this USD value before learning from outliers. Prevents statistics from being skewed by one big win or loss.
⑨ Risk guard
Maximum number of entries/session — Stop new signals after this many trades in a day.
Session loss limit — Pause the trade if the cumulative session P&L falls below this USD amount.
Base suspension after loss — The bar you should wait for after a losing trade. Prevent revenge transactions.
streak limit — Pause after losing this many times in a row.
Pause scale by loss size — Higher losses result in proportionally longer pause times.
force into test matrix — Apply risk rules to background simulations as well. Usually if you leave it out, the matrix will always contain new data.
⑩ Context memory (regime grid)
Enable regime grid — Activates the market context memory system.
Regime/volatility bin — Grid resolution for each axis. The more bins, the higher the resolution, but the slower the confidence builds per cell.
Adjacent blend radius — How well adjacent grid cells blend into each other. High = smoother, but less accurate.
Decay half-life — How quickly old data in a cell loses weight. Low = forget quickly.
Maximum grid impact — To what extent can the regime grid dominate the global optimizer? 0.65 = maximum grid contribution of 65%.
⑪ Traces of corrosion
Trading memory is fading in the short term. Watch especially for large reverse moves to tighten the stop.
enable trace buffer — Activates short-term memory.
fade rate — Energy reduction per bar. High = only very recent results are important.
Reverse movement threshold — MAE in ATR units. Above this the trade will be flagged as a tail event.
guard tightening cap — Maximum stop tightening allowed from tail event feedback.
⑫ Status snapshot
restore string — Paste the previously exported snapshot here to reload the learned parameters and grid cells after reloading.
Export now — When turned on, the current learning state will be output as an alert string. Then turn off the switch.
Import in next bar — Apply the restore string to the next verified bar.
Risk management (TP/SL overlay)
Show TP and SL — Toggle visual overlay.
For TP/SL — Which signal type drives the level — contrarian, AI supertrend, or both.
TP1/2/3 — Take profit multiplier for stopping distance. Set any to 0 to disable that level.
quick tuning guide
Too many noisy signals? Increase Bandwidth → Increase Lookback Window → Increase Signal Interval → Enable Surge Request → Enable Key Level Only.
Too little signal? Lower bandwidth → Lower lookback window → Lower signal spacing → Disable Require Surge → Disable only key levels → Widen RSI hot/cold levels.
Want to adapt faster? Increase reactivity to 15-18 → lower history depth → lower decay half-life.
Want more stability? Lower reactivity to 3-5 → Increase history depth → Increase anchor return interval.
Would you like to start playing a new instrument? Let the indicator run for at least 50-100 bars before evaluating it, then[今すぐエクスポート]to save the learned state and save it after reloading the chart.

