Main achievements
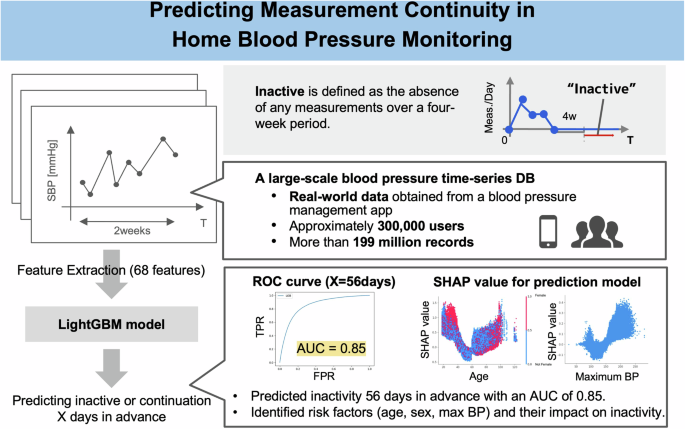
Using a large dataset of blood pressure measurement records from approximately 300,000 users, this study demonstrated that future measurement dropouts can be predicted with high accuracy according to a two-week measurement pattern.
In particular, we achieved AUC values of approximately 0.930 and 0.851 for dropout prediction at 28 and 56 days. The ability to predict shedding four weeks in advance using just two weeks of data is important. According to Wu et al. [20]the effectiveness of an intervention can be predicted based on the 4-week measurement pattern. Therefore, predicting dropout within 2 weeks and improving persistence through intervention may increase treatment efficacy. The impact of an intervention on prediction accuracy is very important. The data included periods with and without push notifications, allowing us to assess the impact of the intervention. Ultimately, we found that the presence or absence of intervention did not affect prediction accuracy, demonstrating that the model is universal and robust. Regarding the dropout rate, we found that the dropout rate was slightly lower during the non-push notification period than during the push notification period. However, these differences may result from calendar time effects such as changes in user demographics, seasonal fluctuations, application design updates, and promotional activities, rather than notifications themselves. Considering that this retrospective analysis was outside the main purpose of the predictive modeling study, we treated it as exploratory and did not further investigate the causal mechanisms.
SHAP analysis revealed that the risk of measurement dropout increased when users had fewer measurement days, a shorter period since their first measurement, fewer measurements in the first 2 weeks, and a relatively low or high maximum SBP value recorded during that period. In particular, the possibility of dropout increased significantly when the maximum SBP exceeded 150 mmHg. This finding suggests that even a single high SBP measurement can have a negative impact on user motivation. Exposure to such high measurements may induce psychological distress, such as anxiety and discouragement, leading to avoidance of further measurements. This psychological conflict may have occurred regardless of antihypertensive drug use. Paradoxically, interventions targeting high-risk groups with elevated blood pressure may improve overall blood pressure control outcomes, and our predictive model may contribute to the development of high-risk strategies. Descriptive statistics in Supplementary Figure 4 further support this finding, showing that users with high or low maximum SBP have higher dropout rates compared to users with intermediate SBP levels. From this observation, we can infer that users in the intermediate SBP range who have not yet reached the commonly recommended goal of approximately 135 mmHg may experience progress and self-efficacy toward achieving that goal, which may foster greater motivation to continue monitoring, thereby leading to longer persistence. SHAP analysis then quantified the strength and direction of this association between maximum SBP and dropout risk within the time series prediction model. Results demonstrated that this model can validate and improve understanding of clinically relevant predictors.
Furthermore, the SHAP value ranking revealed that the number of measurement days within a 2-week period was the most influential characteristic. Four of the top five features (and seven of the top 10 features) are related to measurement conditions and contribute significantly to prediction accuracy. These findings demonstrate that both characteristics related to measurement conditions and traditionally recognized factors such as demographic attributes can be integrated. [14] (such as gender and age) are important in predicting measurement dropout.
Regarding demographic attributes, the SHAP analysis showed that age and gender also contributed to predictions, with younger and older people and women being more likely to drop out. A possible reason for the higher dropout rate among women may be related to the unique time constraints associated with juggling multiple life roles, such as work, household, and caregiving responsibilities. These time demands can make it especially difficult to establish the consistent routines necessary for self-monitoring. Various factors may contribute to the observed U-shaped age trend. The higher risk of dropout among younger participants may be due to a lower perceived urgency for hypertension, which may result in lower motivation to maintain regular monitoring. Additionally, a more dynamic or unpredictable daily life may hinder the formation of consistent measurement habits. In contrast, among older adults, dropouts may be affected by age-related challenges such as cognitive decline, physical limitations that make self-measurement more difficult, and limited familiarity with app-connected digital devices. These findings are consistent with the results of previous studies. For example, similar factors related to persistence have been reported by Pratap et al. [14]. The descriptive statistics in the previous section also confirmed that dropout rates were higher for young people and women than for others. Comparing the distribution of characteristics between young women and other age and gender groups, we found that young women tended to have lower mean blood pressure than other groups (Supplementary Table 2). This group may not have had their blood pressure measured to manage chronic hypertension. Their motivation for measuring blood pressure may be different from other groups. This belief may be correlated with a higher likelihood of dropping out. Additional research studies are needed to identify the specific motivations behind the measurements.
Additionally, users who did not specify gender during application registration were more likely to drop out in both descriptive statistical analysis and SHAP-based analysis of factors in the predictive model. While the underlying reasons for this choice are undoubtedly complex, ranging from privacy concerns to personal identity and initial levels of involvement, this finding suggests that the act of registration itself contains early behavioral markers that predict future compliance.
Consistent with these findings, the SHAP analysis revealed that change in the number of measurement occasions, calculated as the difference between weeks 1 and 2 within a 2-week period, was a significant predictor of dropout. Among these predictor variables, weekday-specific characteristics ranked highest. Therefore, weekday patterns may be particularly predictive of future dropouts. To statistically validate these results, we conducted additional analyzes (Supplementary Figure 5). This confirmed that changes in measurement occasions were significantly different between the continuation and dropout groups across all time frames (full week, weekdays, and weekends).
The stronger predictive power of weekday patterns identified in the SHAP analysis may be due to the fact that weekday measurement behavior has higher temporal resolution and is less influenced by non-routine lifestyle fluctuations compared to weekend measurement behavior. Additionally, separating weekday data eliminates weekend-specific confounding factors. Therefore, weekday indicators may be more sensitive indicators of habit formation or decline.
Strengths
Recently, there has been an increase in research on the clinical effectiveness of home monitoring, as exemplified by research on the blood pressure lowering effect of home blood pressure measurement. However, research that specifically addresses interventions designed to enhance measurement engagement remains limited.
We demonstrate for the first time that dropouts can be accurately predicted by training a model based on measurement patterns. Notably, the model can predict dropouts relatively far into the future using just two weeks of data, allowing healthcare providers to intervene early to prevent patients from discontinuing measurements. Furthermore, the main strength of our study is that we are able to use large-scale real-world data from blood pressure monitor users to identify factors contributing to measurement continuation/discontinuation and to validate a generalized predictive model showing the relationship between vital sign measurement patterns and measurement continuity.
Patient support through communication tools [21] Intervention by a medical professional [22] Effectively increases adherence. By leveraging the predictive model developed in this study, more effective and efficient intervention strategies can be developed for rapid scale-up. [4, 23,24,25] Prevent dropouts with digital healthcare services such as Digital Therapeutics (DTx) and RPM. Further research is needed to determine the optimal timing and method of intervention, including message content. [26].
Restrictions
Although the strengths mentioned in the Strengths section are noteworthy, the data used in this study is limited to people within Japan. Additionally, the Omron Connect Application dataset does not include information on treatment status or healthcare provider involvement due to privacy and data limitations. Therefore, differences in cultural background, economic situation, and health consciousness, which may vary by country or region, may have been introduced into the study. Another limitation is that the definition of “dropout” (absence of measurements for 28 consecutive days) applies strictly to non-use of the platform used in this study and does not distinguish whether a user has completely stopped performing measurements. Therefore, although unlikely, some users who dropped out may have continued to measure outside of the platform.
Furthermore, this study focuses only on blood pressure data. The results can also be applied to other types of measurements, such as weight and blood sugar monitoring, to support continuity.
Although no significant differences were found between the presence and absence of push notifications, the impact of more intensive interventions on prediction accuracy was not investigated. Future research should develop interventions tailored to specific measurement patterns and evaluate their effectiveness and impact on predictive models.
outlook
Given the limitations of this study, there is a need to evaluate the generalization performance of the model using data from other countries to examine racial and regional differences. Furthermore, the relationship between measurement patterns and continuity may vary depending on the patient’s medical history, which requires further investigation. Furthermore, although this model predicts future dropout probabilities, the actual effectiveness of interventions based on these predictions has not been tested. Note that interventions may not necessarily be effective for users who are more likely to drop out. [27]. Future research should focus on classifying users according to surveys or similar methods and optimizing intervention messages and timing accordingly. [21].
There are many factors contributing to poor adherence. [28, 29]However, this study did not identify specific factors such as decreased patient motivation or time constraints. In the future, factors contributing to poor adherence should be analyzed along with predictive modeling to develop more targeted intervention strategies.
In conclusion, we developed and validated a LightGBM model that predicts future home blood pressure measurement discontinuation using just two weeks of vital signs and demographic data from approximately 295,758 Omron Connect users. The model achieved high predictive accuracy (ROC-AUC of 0.930 for 28 days and 0.851 for 56 days) and identified key predictors, particularly measurement frequency patterns, peak systolic blood pressure, and weekday-specific changes. These insights will enable healthcare providers to implement timely and targeted interventions aimed at improving patient adherence to home monitoring and ultimately enhancing blood pressure control in clinical practice.