The experiment used in this article will use Python to build a convolutional neural network model in TensorFlow 2.50 environment. TensorFlow is an open-source machine learning framework developed by Google, which can represent computing tasks through data flow graphs and flexibly construct deep neural network models and other machine learning models. The programming software used is PyCharm 2021, which has functions such as intelligent editor, automatic code completion, syntax highlighting, code navigation, debugger, and unit testing tool, enabling developers to develop Python applications more efficiently. The computer CPU used is i5-8250U, with a memory size of 16 GB.
This chapter uses the method of comparative experiments to verify and discuss the various performance of the three lightweight models established, as shown in Fig. 16.

Schematic diagram of controlled trial.
Comparison of running speeds of different models under the same training times
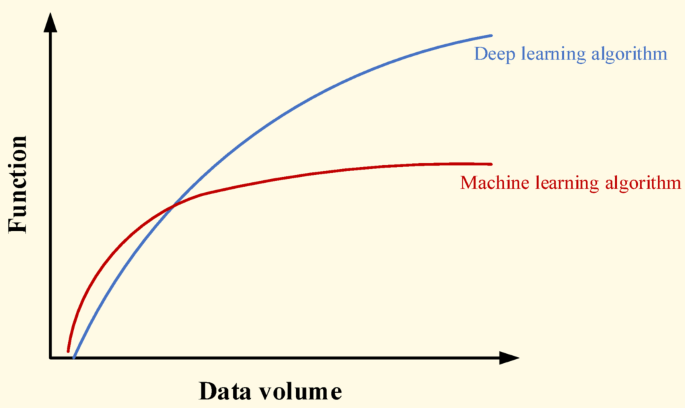
Although stacking parameters and designing more complex structures can improve the accuracy of models in deep learning, it can also lead to an increase in the computational complexity of the model and a slower training speed30,31. Therefore, how well the model predicts is not the only factor to consider, as long training time can lead to an increase in costs. The computation of convolutional neural networks is divided into CPU computation and GPU computation, with GPU computation speed approximately 40% higher than CPU computation speed. Considering that not every computer can be calculated using the GPU method, all subsequent experiments in this article will be conducted using CPU. The network architecture also has a significant impact on the running speed of the model, and the lightweight convolutional neural network model, due to its concise structure, makes the diagnosis speed very fast.
In Fig. 17, the duration of program operation is used to demonstrate the speed of training. In order to demonstrate the fast iteration speed of lightweight convolution, a fault diagnosis model based on One-dimensional Residual Convolutional Autoencoder self-coding(1DRCAE)32, wide convolutional kernel neural networks fault diagnosis model(WDCNN)33 and Support Vector Machine(SVM)34 are added during comparative experiments. From the figure, it can be seen that in the overall comparison, 1DRCAE has the longest diagnostic time due to the presence of an autoencoder, which has the largest computational complexity among all models. Among the three lightweight convolutions established in this article, SqueezeNet-DLCNN takes the longest time due to its deepest convolution layers. However, in overall comparison, it can be seen that it still has a fast diagnostic speed. MobileNet-DLCNN, with its modeling concept of directly reducing parameters in convolution, has the highest diagnostic efficiency, with an average of 50 diagnostic operations completed in one minute.

Comparison of program runtime under different training times.
Comparison of accuracy of lightweight models under different datasets
Under different operating conditions such as load and speed, the features extracted by signal extraction techniques may vary. In order to verify the generalization characteristics of the three lightweight models in this article and whether the models can operate stably under different operating conditions, four types of fault data of the drive end (DE) under different operating conditions, namely 0HP, 1HP, 2HP, and 3HP, were selected from the Case Western Reserve University dataset, and the dataset compiled from the MFPT bearing dataset of the American Society for Mechanical Fault Prevention and Prevention Technology. Input the fault datasets of both into the model for diagnosis, and the details of the dataset parameters are shown in Table 4.
The fault data of the driver end (DE) in the Case Western Reserve University dataset is the most stable and is often used to verify the accuracy of various fault diagnosis models. From Fig. 18a, it can be seen that the three lightweight fault diagnosis models have good diagnostic effects, with accuracy rates of over 95%. MobileNet-DLCNN performs well and has high adaptability in the 0HP dataset of CWRU. ShuffleNet-DLCNN has higher accuracy than the other two models at 1HP. SqueezeNet-DLCNN performs well on every dataset, especially on the MFPT dataset. Due to the different data types in the MFPT dataset, the diagnostic accuracy of each model is lower than that of CWRU. SqueezeNet-DLCNN achieved the highest accuracy among the three due to its very deep convolution. Figure 18b shows the grouped box diagrams of the three models constructed in this article under different datasets. Box plots can clearly and intuitively express the distribution range of data, and can show the maximum, minimum, median, quartile, and three-quarter percentile in the graph. The distribution of accuracy of each model can be seen from the figure.

Comparison of model accuracy under different datasets. (a) Bar chart of model accuracy under different datasets. (b) Model grouping box diagram under different datasets.
In order to demonstrate the accuracy of the three lightweight models established in this article more clearly, the accuracy curves and Loss curves of the three models are now output on the 0HP dataset of CWRU and MFPT bearing dataset. As shown in Fig. 19, the ShuffleNet-DLCNN model did not perform well in the early stages of processing, but the fitting effect improved as the diagnosis progressed. When processing the MFPT bearing dataset, SqueezeNet-DLCNN has the best diagnostic performance, and it can be seen from the Loss curve of MobileNet-DLCNN that the fitting effect is slightly worse in the later stage.

Curve plots of model accuracy and loss rate under different datasets. (a) Accuracy curve of lightweight model under 0HP. (b) Loss curve of lightweight model under 0HP. (c) Accuracy curve of lightweight model under MFPT. (d) Loss curve of lightweight model under MFPT.
Comparison of noise resistance of lightweight models
Considering the influence of noise in the actual industrial situation, colored noise is added to the data set to simulate the field of bearing application. After the fault signal is converted from time domain to frequency domain, the influence of frequency domain signal on the fault signal is smaller than that of time domain signal. When the data added with colored noise is used, a certain amount of error will be caused.
In order to more intuitively see the change in the accuracy of the model after adding noise, an error bar chart with significant marks is drawn as shown in Fig. 20. Error bar is a graphical representation method used to display the variability or uncertainty of data. Significance can indicate the difference between two columns, with the more asterisks, the more significant the difference. We added WDCNN, which has also undergone anti-noise training, as well as 1DRCAE and SVM, which have not undergone anti-noise training, for comparison. Six models were trained five times in each dataset to calculate the error and standard deviation. From Fig. 20, it can be seen that the accuracy of the model fluctuates after adding noise, and ShuffleNet-DLCNN is the most stable in comprehensive comparison. WDCNN still has high accuracy under noise interference, especially at 0HP, its accuracy and stability are higher than the three lightweight models proposed by the standard. However, in practical experiments, it was found that the single run time of the WDCNN model is longer than that of the lightweight model. After considering all factors, the lightweight convolution proposed in this paper is more excellent. As a machine learning SVM, its diagnostic ability is poorer compared to deep learning, and the addition of noise further affects its diagnostic ability. ShuffleNet-DLCNN demonstrated superior performance in the 1HP dataset, with higher accuracy than the other two models in normal conditions even in the presence of noise interference. When the load changes, the collected bearing vibration signal is unstable. When there are significant changes in speed and load, the impact of noise on the model also increases, making it difficult to extract effective data during convolution processing. Therefore, the performance of the three models in MFPT is poor. As the speed decreases, the impact of noise on SqueezeNet-DLCNN intensifies, resulting in a decrease in diagnostic effectiveness.

Bar chart of accuracy error bar of noise model added under different datasets.
The confusion matrix is an indicator to evaluate the results of the model, which is part of the model evaluation. It is also the most basic, intuitive and simple method to measure the accuracy of the classified model. As shown in Fig. 21, nine types of faults and one normal situation are sorted and classified according to 0–9. The main diagonal of the confusion matrix is the recognition accuracy, the abscissa is the predicted fault type, and the ordinate is the actual fault type. Using the confusion matrix, we can see more clearly the accuracy of the three lightweight models under two data sets and whether noise is added. Figure 21a shows the confusion matrix of the three models under the DE dataset of CWRU 0HP. It can be seen that the three models have poor recognition effect on rolling element faults and good diagnosis effect on outer ring faults. After adding noise, the recognition ability of rolling element faults decreases. As shown in Fig. 21b, the model is prone to misdiagnosing rolling element faults as inner ring faults under noise interference. As shown in Fig. 21c, due to the close proximity of the rolling element to the inner ring, the fault types of the two have a certain degree of overlap. In the MFPT bearing dataset, the model is prone to confuse normal conditions with rolling element faults. After adding noise to the MFPT bearing dataset for fault diagnosis, it was found that the diagnostic ability of MobileNet-DLCNN decreased most significantly, and for the first time, there was confusion between rolling element faults and outer ring faults, as shown in Fig. 21d.

Comparison chart of model accuracy confusion matrix before and after adding noise under different datasets. (a) Accuracy confusion matrix under 0HP. (b) Accuracy confusion matrix with noise under 0HP. (c) Accuracy confusion matrix under MFPT. (d) Accuracy confusion matrix with noise under MFPT.
Comparison of migration diagnosis capabilities across different datasets
Under different loads, the number of characteristics of vibration signals varies, the amplitude is not constant, and the period and phase of oscillation also vary greatly. This will result in the classifier being unable to correctly classify faults of the same type under different loads, thereby reducing the recognition speed of the diagnostic system.
As shown in Fig. 14, the data set of CWRU can be divided into 0HP, 1HP, 2HP and 3HP according to different rotational speeds, and the transfer learning between them is recorded as I ~ III. Because the vibration signals are collected at different positions, the signals collected at three different positions under each data set are transfer learning, and the process is recorded as a ~ l. Considering that the MFPT dataset and the CWRU dataset belong to different data types, the transfer learning between the two datasets is recorded as A ~ H. In the training process of transfer learning, one party’s data is used as the training set and verification set, and the other party’s data is used as the test set. Using the Adam gradient descent algorithm to adaptively optimize the parameters, the epoch is selected as 50. After multiple experiments, the batch size was determined to be 64. As can be seen from Table 5, the accuracy of ShuffleNet-DLCNN and SqueezeNet-DLCNN increases gradually with the gradual decrease of rotational speed during transfer learning between data sets at different rotational speeds. MobileNet-DLCNN has weak diagnostic ability under variable speed transfer learning, and is not easy to adapt to speed changes in actual work.
Figure 22 shows the comparison of transfer learning across datasets. According to Fig. 22a, at the same speed, there is a certain rule of transfer learning between different signal acquisition positions. Generally speaking, the migration diagnosis ability between the drive end (DE) and the fan end (FE) is weak, which may be due to the loss of vibration signals during transmission. The diagnostic effect is relatively stable when it comes to the base end (BA). On the whole, SqueezeNet-DLCNN still has the best diagnostic ability, and the average accuracy of transfer learning among bearing data sets of Case Western Reserve University is higher than 95%. Figure 22b shows the transfer learning under different data types. Here, the data of drive end (DE) and base end (BA) under MFPT dataset and Case Western Reserve University data sets under four different working conditions are used for transfer learning. In order to make the comparison more obvious, WDCNN,1DRCAE and SVM are added here.

Cross dataset transfers learning accuracy image. (a) Comparison diagram of transfer learning at different positions at the same speed. (b) Clustering comparison chart of transfer learning under different data types.
It can be seen from Table 6 that MobileNet-DLCNN has the best learning effect under the learning of DE data and MFPT data migration under 0HP working condition, and the results of Fig. 20 also show that it has the strongest anti-noise ability under 0HP. From this, it can be concluded that MobileNet-DLCNN has the optimal diagnostic capability at 0HP. In transfer learning other than those involving 0HP, ShuffleNet-DLCNN and SqueezeNet-DLCNN have similar trends, and SqueezeNet-DLCNN has a higher diagnostic ability. Even on two datasets with different data types, the average accuracy of SqueezeNet-DLCNN reached 94%. The diagnostic performance of WDCNN is still excellent at 0HP, but its diagnostic ability shows a cliff like decline at 1HP, and the subsequent diagnostic trend is also different from that of lightweight convolution. It is speculated that this situation may be due to the different ideas of WDCNN and the three lightweight convolutional variable condition diagnosis proposed in this article. WDCNN adopts a wide convolutional kernel, which can collect more data at a single time. The three lightweight convolutions proposed in this article use compression, grouping, small convolutional kernels, and deepening the network layers for diagnosis. 1DRCAE is also capable of transfer learning due to the residual network and self-coding nonlinear dimensionality reduction. Due to the lack of consideration for variable operating conditions during the design of SVM, the overall diagnostic performance is poor.
In order to have a clearer view of the diagnostic capabilities of the three models for bearing faults, dimensionality reduction operations were performed on the three models and images were output. The so-called dimensionality reduction refers to using 2 or 3 dimensions to represent multidimensional data. The full name of T-SNE is T-distributed Stochastic Neighbor Embedding. T-distribution random nearest neighbor embedding is a technology that combines dimensionality reduction and rendering. It is based on SNE visualization enhancement and solves the characteristics of sample distribution congestion and SNE boundary blurring after imaging. T-SNE models the similarity of the original space as probability density, and the distribution of similarity is given by Gaussian distribution. The original signal graph without classification operation after dimensionality reduction is shown in Fig. 23. In short, in the original space, the similarity between a point and other points can be expressed by a probability density distribution:
$$p_{j|i} = \frac{{\exp ( – \frac{{\left\| {xi – xj} \right\|^{2} }}{{2\sigma_{i}^{2} }})}}{{\Sigma_{k \ne i} \exp ( – \frac{{\left\| {xi – xk} \right\|^{2} }}{{2\sigma_{i}^{2} }})}}$$
(8)

T-SNE distribution map of original signal.
In the dimensionality reduced space, we use the student t-distribution instead of the Gaussian distribution because the student t-distribution can retain more similarity over longer distances. So in the target space after dimensionality reduction, the joint probability distribution is:
$$q_{j|i} = \frac{{(1 + \left\| {yi – yj} \right\|^{2} )^{ – 1} }}{{\Sigma_{k \ne l} (1 + \left\| {yk – yl} \right\|^{2} )^{ – 1} }}$$
(9)
From Fig. 23, it can be seen that the original input signal has the maximum entropy and the highest degree of confusion. Various faults are mixed together and cannot be separated, and the feature interval is relatively fuzzy. During the diagnostic process, a certain moment is intercepted for dimensionality reduction, as shown in Fig. 24a. It can be seen that all three models exhibit certain classification capabilities after undergoing a period of convolution operation. Fault data of the same category has begun to converge, and some fault data has even been completely separated.


T-SNE classification and dimensionality reduction diagram for each dataset. (a) T-SNE classification dimensionality reduction diagram during the diagnostic process of each model under 0HP. (b) Final T-SNE classification dimensionality reduction diagram for each model under 0HP. (c) T-SNE classification dimensionality reduction diagram during the diagnostic process of each model under MFPT. (d) Final T-SNE classification dimensionality reduction diagram for each model under MFPT.
It can be seen that the classification ideas of ShuffleNet-DLCNN and SqueezeNet-DLCNN are similar, and their separation situation is similar. The final classification and dimensionality reduction diagrams of the three models are shown in Fig. 24b. As shown in the figure, the fault data is separated into its own groups, and many fault data of the same type have already overlapped. There is another type of failure in MobileNet-DLCNN that is not fully clustered, and there are entanglements between several groups. Compared with the other two lightweight models, the classification performance is worse, with all 10 types clustered and more dispersed.
To quantitatively evaluate the clustering quality, we calculated the contour scores for each model. SqueezeNet DLCNN achieved the highest score (0.82 under CWRU and 0.75 under MFPT), indicating clearer differentiation between fault categories. In contrast, SqueezeNet DLCNN has a more significant classification performance, minimal diagnostic error, and no inter group interference. In Figs. 24c and d, it can be observed that the classification performance of the MFPT dataset is slightly inferior to that of the CWRU dataset. The reason for this situation may be due to different fault classification situations.
The lightweight, efficient, and noise resistant deep learning framework designed by our research institute has potential applications beyond mechanical fault diagnosis. The core advantage of this framework—extracting robust features from complex signals and performing efficient classification—makes it highly suitable for other fields with similar challenges. For example, in the field of medicine, understanding the crosstalk between lung cancer pleural metastases and tumor epithelial cells relies on the analysis of complex cell communication signals 35; In environmental acoustic monitoring, it can be used for species call recognition or abnormal event detection. Recent research in non mechanical fields, such as disease prediction models based on deep learning, has also demonstrated the generality of similar techniques 36. Therefore, transferring this model to these fields is a highly promising future direction.