The results were compared with the work of (Sayed, GI et al. 2019), who developed a machine learning-based detection method for RPW using a very limited dataset to validate the performance of the proposed LPC-based Bi-LSTM model.12. Although their model was promising, it suffered from overfitting and poor generalization, resulting in poor accuracy and uneven performance on larger or unknown datasets. The research work used a larger and more diverse dataset containing 3,000 RPW and non-RPW samples, resulting in a classification accuracy of 98.02%. The combination of LPC feature extraction, cosine similarity-based feature matching, and Bi-LSTM architecture enabled robust identification even in acoustically noisy environments.
Data acquisition
The audio dataset used in this study consists of approximately 3000 acoustic segments evenly divided into RPW and non-RPW signals (Table 3).
Pretreatment
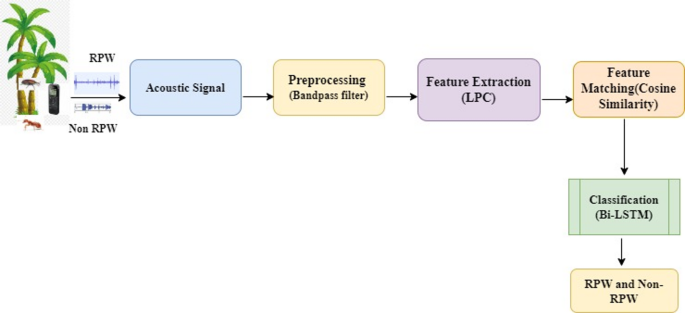
Bandpass filters are used to collect and filter data. Frequency range of approx. [500–2500 Hz] used for detection13. A bandpass filter is used to isolate and enhance the unique frequencies associated with RPW. Figure 6 shows that the filtered signal has energy concentrated within specific frequency bands of the RPW.

Filtered acoustic signal representation of red palm weevil (RPW) sounds.
Feature extraction
LPC coefficient
LPC coefficients are numerical assets obtained by analyzing audio signals. The coefficients represent the filter parameters that best approximate the audio signal (Martin, B. et al., 2015.). The LPC spectrum represents the content of the signal after LPC analysis. The coefficients are used to model the spectral envelope of the signal. Comparisons are made between the reference and infected and uninfected.14 (Table 4).
LPC coefficients are vector quantities. The LPC order is set to 14 using the optimal order. Fifteen such coefficients were extracted (Palaniammal, K et al., 2021) (Table 5).
Spectral envelope and bandwidth
The power spectrum represents the distribution of signal energy across different frequencies.15,16. The spectral envelope can be obtained by smoothing the power spectrum or estimating the main spectral peaks, also known as formants (Devi, N., 2023).

Plot the presence of spectral bandwidth for reference against uninfected wav files.
As shown in Figure 7, the frame index in the spectral bandwidth feature plot represents the time of each frame of the original audio signal. Spectral bandwidth features represent the amount of energy in the frequency domain of each frame (Dehner, C et al. 2022). The similarity score of each live file is checked against a threshold. If the similarity score is greater than or equal to the threshold, red palm weevil is detected in that live file.17. Otherwise, the red palm weevil will not be detected in that live file. Figure 7 shows that the “file index” on the cosine similarity graph simply indicates the position of each live audio file within this file list.

Indexing files based on cosine similarity for efficient information retrieval.
Cosine similarity feature matching
Figure 8 shows the cosine similarity score for a collection of live wave files. The Y-axis represents the similarity value and the X-axis represents the file index. A number of files have high similarity scores between 0.7 and 0.85, which are considered to be very similar to the reference RPW sound pattern. On the other hand, files around index 6 to 8 have low similarity values (0.4 to 0.5), indicating weak or noisy signals. A partial match is suggested by files with medium similarity values (0.5 to 0.6). This may have been caused by a low-intensity intrusion. This finding confirms that cosine similarity distinguishes RPW-infected signals from noise-free or uninfected recordings, supporting our classification framework.
classification
Combining LSTM with other neural network architectures such as CNN. It is very applicable to image analysis. The three gates that control memory cells are the input gate, forget gate, and output gate.18. Input gates condition the data entering the memory cells. Forget gates control what data is removed from memory cells. Table 6 shows the Bi-LSTM classification model.

Confusion matrix showing the model’s predictive classification performance.
confusion matrix
The ratio of true positives (TP) to total false positives (FP) is shown in Figure 9. Recall is a performance metric that quantifies the proportion of true positives that a model or system correctly identifies.19,20. A statistic called the F1 score is often used to evaluate how well a binary classification model is performing. The maximum F1 score is 1 and the minimum is 0. Sensitivity refers to true positive rate (TPR). This is the proportion of actual positive cases that are correctly identified as positive by the model. It is a measure of the model’s ability.
Evaluation index
Precision, precision, F1 score, sensitivity, specificity, and recall (sensitivity) are some of these measurements. Accuracy quantifies the proportion of true positive predictions out of all predicted positive cases. Sensitivity (another name for recall), on the other hand, is the proportion of actual positive cases that the model correctly detects. Equations 5, 6, and 7 show the precision, precision, and recall metrics.
$${\text{Accuracy}}\,{\text{=}}\,\frac{{{T_{Positive}}+{T_{Negative}}}}}{{{T_{Positive}}+{T_{Negative}}+{F_{Positive}}+{F_{Negative}}}}$$
(5)
$${\text{Accuracy}}\,{\text{=}}\,\frac{{{T_{Positive}}}}{{{T_{Positive}}+{F_{Positive}}}}$$
(6)
$${\text{Remember}}\,{\text{=}}\,\frac{{{T_{Positive}}}}{{{T_{Positive}}+{F_{Negative}}}}$$
(7)
These two measures are balanced by the F1 score, which is the harmonic mean of precision and recall. Acoustic signal-based detection methods successfully identify the red palm weevil (RPW) infesting palm trees, showing remarkable early detection. The system’s excellent accuracy of 98.02% is achieved by utilizing MATLAB-based techniques such as Bi-LSTM for classification.twenty one. Compared with current methods, this performance improvement demonstrates the effectiveness and scalability of the proposed approach, making it a more reliable, useful, and beneficial option for agricultural pest monitoring. Table 7 shows the evaluation metrics of Bi-LSTM.