Construction of a machine learning signature
We collected TF genes from the ImmReg database and conducted an in-depth biological study. Using a ten-fold cross-validation method, we constructed a machine learning-derived TF signature (MDTS) with 108 algorithm combinations. Each model was evaluated by calculating the average C-index of each algorithm in the training cohort and eight external cohorts. The RSF algorithm, which achieved the highest average C-index of 0.668, was selected as the final model (Fig. 1A). We built and tested the model using RSF with 1000 times (Fig. 1B). The point with the lowest error rate was chosen, and the corresponding gene was identified. We assessed the prognostic value of these TF genes through univariate Cox regression and calculated the Hazard Ratio (HR) for these genes across the nine cohorts (Fig. 1C).
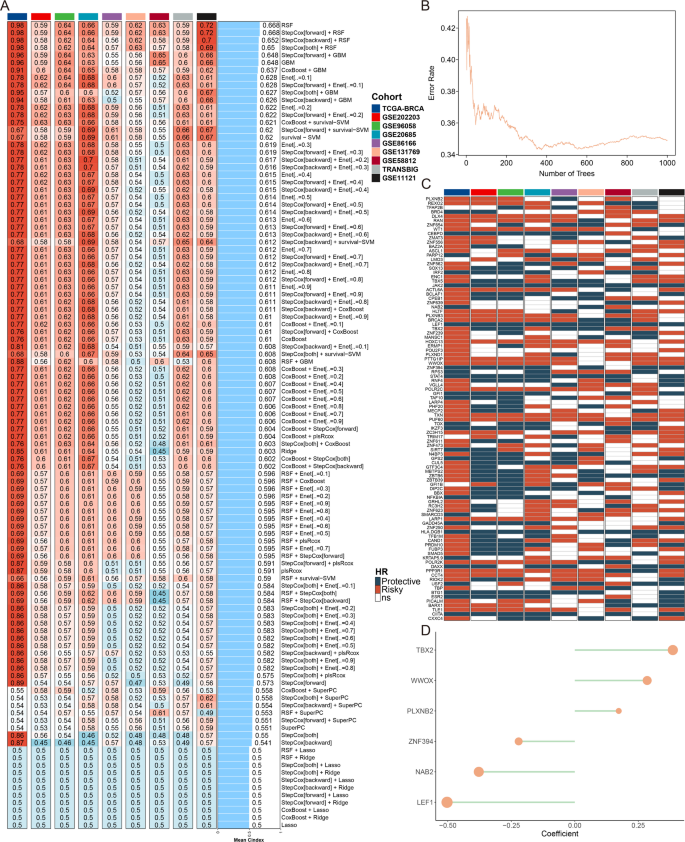
Construction of a machine learning signature. (A) Average C-index for each machine learning algorithm combination in the TCGA-BRCA training cohort and 8 validation cohorts. (B) Plots of the error rate for 1000 cross-validations. (C) Key TF genes associated with breast cancer prognosis. (D) Final selection of six TFs based on an exhaustive search, with patient risk scores calculated according to the expression levels of these genes and their regression coefficients
An exhaustive search was then conducted to identify the most predictive subset of these genes. Exhaustive search involves evaluating all possible combinations of features to find the subset that offers the best predictive performance, ultimately selecting six TF genes. Each patient’s risk score was subsequently calculated based on the expression levels of these TFs, weighted by their regression coefficients (Fig. 1D). Survival analysis from the nine cohorts indicated that our model effectively distinguished patients with high and low MDTS, suggesting that MDTS is a valuable tool for predicting the survival of breast cancer patients (Figure S1).
Evaluation of MDTS with clinical characters and published signatures
Univariate and multivariate Cox analyses indicated that MDTS is an independent risk factor when compared with other clinical indicators (Figure S2A). A clinical nomogram incorporating MDTS, stage, and age was developed to estimate the 1-, 3-, and 5-year overall survival (OS) probabilities for breast cancer patients (Figure S2B). The calibration curves for the prognostic nomogram closely matched the expected and observed survival rates for the entire cohort, underscoring its superior performance (Figure S2C-E). Furthermore, the area under the curve (AUC) for MDTS was higher than that for other clinical variables in the ROC curve, indicating enhanced predictive power (Figure S2F).
To evaluate the stability of MDTS, 103 published breast cancer signatures were manually collected and assessed across 10 independent cohorts. The results revealed that only MDTS was statistically significant in all 10 cohorts (Fig. 2A). The predictive ability of each model was evaluated by comparing their average C-index across different datasets. The model consistently ranked highly in all cohorts, placing first in 4 cohorts, second in 2 cohorts, fourth in 1 cohort, sixth in 2 cohorts, and seventh in 1 cohort, demonstrating the robustness of MDTS (Fig. 2B).
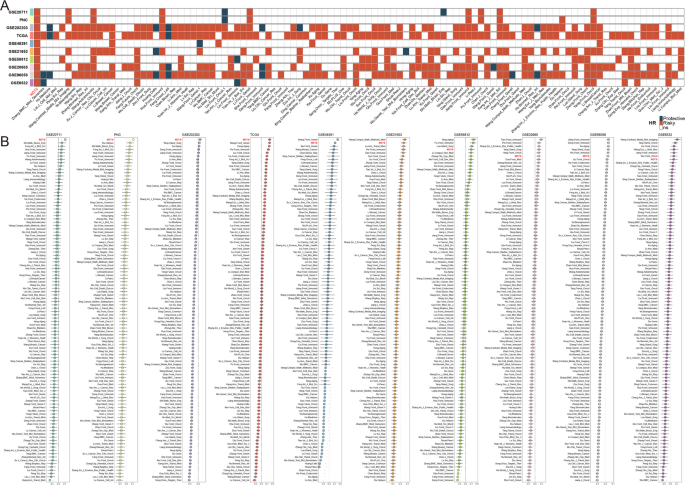
Evaluation of MDTS with clinical characters and published signatures. (A) Univariate Cox regression analysis showing that the MDTS model maintains complete significance across all datasets. (B) C-indices of all cohorts for each signature
Genetic alteration landscape of MDTS
To account for genomic heterogeneity of MDTS, we further analyzed gene mutations and copy number changes in both groups (Fig. 3A). Combined with TCGA database of 10 classic signaling pathways of cancer, we observed that the classic tumor-suppressor genes, such as TP53, NOV, SAV1, MOB1A/B, CRB1/2, LRP5/6 and GSK3B, might play in the high MDTS groups, the opposite is true for RPS6KA3, RAC1 and IGF1R (Fig. 3A, B). We further compared TMB between high MDTS and low MDTS groups. The results showed that patients with high MDTS had a higher TMB compared to patients with low MDTS (Fig. 3A, C). Moreover, we delved deeper into the CNA scenery of the two groups. Compared to the low MDTS group, the high MDTS group were significantly more amplificated or deleted in the chromosome arm levels, Like the amplification of 6p23, 8q24.21, 10p15.1, 17q12, 20q13.2, and the deletion of 9p21.3, 9p23, 11p15.5, 16q24.3, 22q12.32 (Fig. 3A, D). Taking 6p23 and 9p23 as examples, the high MDTS group showed significant gene amplification on chromosome 6p23 (GFOD1, CD83, NOL7, SIRT5) and significant gene deletion on chromosome 9p23 (PTPRD, NFIB, MPDZ, TYRP1) at the gene level (Fig. 3A). In conclusion, high TMB, high frequency of gene mutation, and deletion and amplification of genes on chromosome arms may be one of the reasons for poor prognosis.
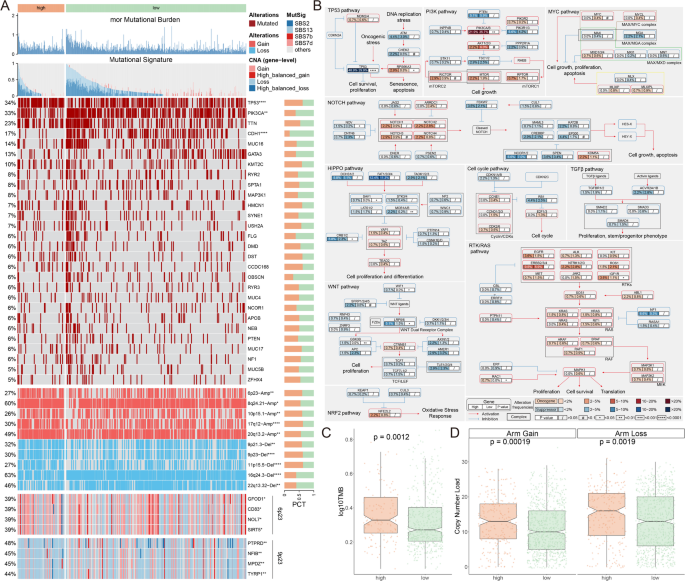
Genetic alteration landscape of MDTS. (A) Multi-omics analysis showing TMB, mutational signatures, gene mutations, and copy number variations. (B) Analysis of 10 oncogenic signaling pathways highlighting differential mutation frequencies between high and low MDTS groups. (C) TMB analysis indicating significantly higher TMB in the high MDTS group. (D) CNA landscape showing significant amplifications and deletions in high MDTS group compared to low MDTS group
Analyzing the biological mechanisms of MDTS using single-cell sequencing
We selected 14 patients (5 normal tissue and 9 breast cancer tumor tissue) for further evaluation of MDTS (Figure S3A-B), dividing the cells into 19 clusters and 8 cell types (Fig. 4A-B). The number of 8 types of cells was counted, and the percentage of their cell types in the body of these 14 patients was analyzed (Figure S3C-D). The next step is to look at the representative markers of each of the eight cell types and the actual distribution of these markers in the cell (Fig. 4C, S3E). Single-cell sequencing revealed differences in the transcriptome of each cell type in tumor and normal tissue. The results indicate that plasma cells, macrophages, B cells, T cells, fibroblasts and epithelial cells are notably enriched in tumor tissues, while other cells are highly represented in normal tissues (Fig. 4D).
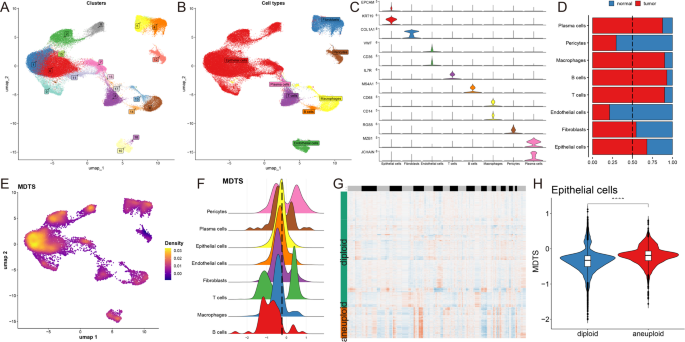
Analyzing the biological mechanisms of MDTS at the single-cell level. (A) Identification of 19 clusters in single-cell transcriptome analysis. (B) Classification of 8 cell types. (C) Representative markers for each cell type. (D) Distribution of cell types between tumor and normal tissues. (E) MDTS scores across cells showing significant differences in distribution. (F) Grouping of cells based on epithelial cell peaks. (G) CopyKat algorithm analyzed the distribution of diploid and aneuploid cells. (H) Comparison of MDTS scores between aneuploid and diploid epithelial cells. ****P < 0.0001
MDTS were included in the single cell analysis to obtain a specific cell distribution map (Fig. 4E), and all cells were categorized into high and low MDTS groups according to the peak MDTS score of epithelial cells (Fig. 4F). The potential pathways of MDTS were enriched and visualized by differential expression analysis and GSEA (Figure S3F, G). Take the epithelial cells for example, high MDTS cell was notably enriched in cadherin binding involved in cell-cell adhesion, GTP binding, proton transmembrane transporter activity. While the low MDTS cell was predominantly associated with electron transfer activity (Figure S3G). Additionally, we performed single cell CNA analysis using the CopyKAT package, which discriminates malignant from normal cells. Cells with obvious CNA in aneuploid tumors were successfully captured (Fig. 4G). Finally, the risk score was performed according to the model established by MDTS, and the result showed that the level of polyploid epithelial cells in the tumor cells in this model was more than that of diploid epithelial cells (Fig. 4H).
Analyzing specific regulatory factors driving MDTS and cell recognition
To fully construct the transcription factor regulatory network, we used SCENIC pipeline to calculate the regulatory activity score (RAS) of transcription factors in all single cells, which we then submitted to build regulatory maps for eight cell types (Fig. 5A, B). We observed that the overall differentiation trajectory of the eight cell types revealed by the regulator was consistent with that revealed by the single-cell transcriptome. We then performed PCA and variance analyses for different cell types, where PCA1 revealed specific transcription factors for cell type formation, while PCA2 was associated with MDTS specific transcription factors (Fig. 5C, D).
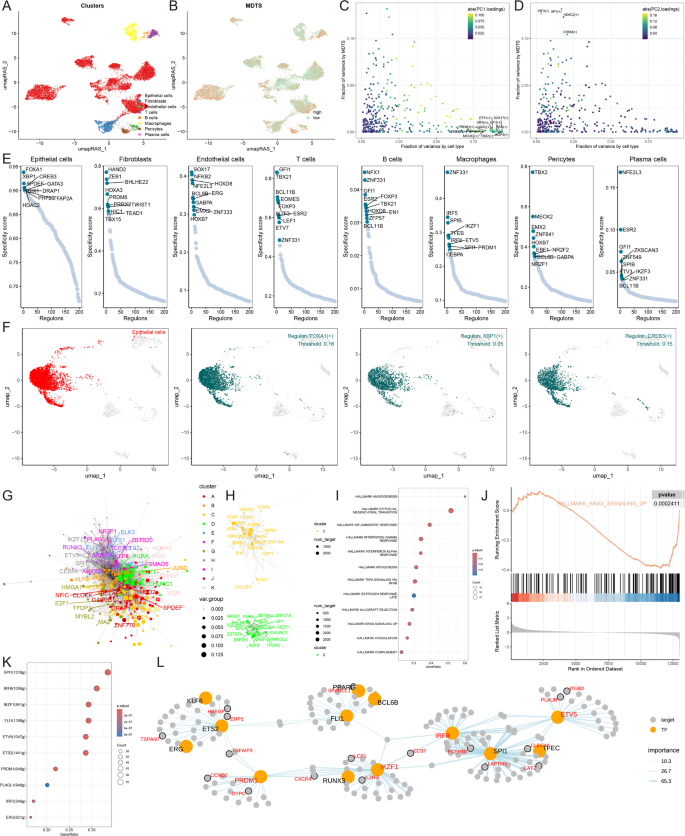
Analyzing specific regulatory factors driving MDTS and cell recognition. (A) Clustering of cell types using UMAP. (B) SCENIC pipeline analysis translating gene expression data into RAS for transcription factors. (C) Variance decomposition using PCA to identify PC1 representing cell type-specific TFs. (D) PC2 representing MDTS-specific TFs. (E) Regulon specificity scores (RSS) highlighting key regulators for different cell types. (F) UMAP plots showing specific regulators for epithelial cells. (G) Transcription factor interaction networks organized by RAS similarity using the Leiden algorithm. (H) Important transcription factor components in MDTS. (I) GSEA results showing signaling pathway changes in high MDTS epithelial cells. (J) Specific pathway like KARS activation. (K) Identification of transcription factors contributing to KRAS signaling. (L) Network diagrams illustrating regulatory relationships among transcription factors
We next identified 10 key transcription factors recognized by each cell and scored the specificity of each regulator according to Jensen-Shannon divergence. From these 8 cell types, the regulatory factors with high RSS scores were selected for matrix analysis, and it was found that FOXA1, XBP1 and CREB3 were the most specific regulators related to epithelial cells (Fig. 5E, F). The specific regulators most associated with the other seven cell types were also analyzed (Figure S4A).
Transcriptional activations in organisms that are cooperative among transcription factors are crucial for understanding transcriptional regulation mechanisms. To understand how transcription factors work together to regulate specific biological functions in the MDTS model, we compared RAS scores for each regulatory pair in the map to characterize the combined pattern of MDTS, according to the Leiden algorithm. The cluster analysis results showed that a total of 11 transcription factor clusters were obtained (Fig. 5G; Figure S4B), where the contribution rate of class C and class D to the development of MDTS is relatively high, so we separately show the transcription factors of class C and Class D (Fig. 5H; Figure S4B). Take the epithelial cells for example, multiple pathway activation in epithelial cells was identified by GSEA analysis, and the results showed that MAPK/KRAS signaling pathways were inhibited in the high MDTS cell (Fig. 5I, J). Next, the transcription factors related to this pathway and influencing MDTS progression were further identified (Fig. 5K), and the network diagram of regulatory relationships among transcription factors was shown (Fig. 5L).
Cell-cell communication based on MDTS
Cell-cell communication is essential to multicellular organisms because it allows functionally unique cell populations to coordinate their responses to both internal and external conditions. To highlight the complex interactions between cells in breast cancer progression, we used CellChat to analyze the communication networks. We evaluated the cell interactions between high and low groups and observed that the high MDTS cells had a stronger cell interaction (Fig. 6A). The strength for both outgoing and incoming signals elevated dramatically in endothelial cells, epithelial cells, fibroblasts and plasma cells, validating their key roles in the pathological remodeling of high MDTS (Fig. 6B). Notably, epithelial cells were enhanced with incoming signals from other cells, e.g., endothelial cells. Moreover, T cell were less communicated with other cells.
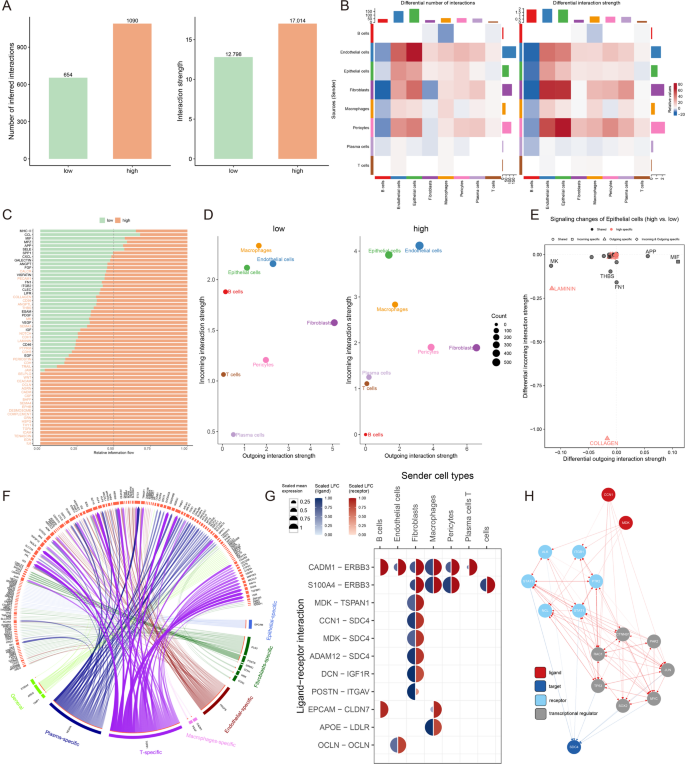
Cell-cell communication based on MDTS. (A) Analysis of the quantity and strength of cell interactions showing reduced communication in the high MDTS group. (B) Interaction network visualization of cell communication. (C) Comparison of signaling pathways between the two groups. (D) Analysis of outgoing and incoming interaction intensity. (E) Specific pathways in epithelial cells related to MDTS. (F) Circos diagram depicting significant ligand-receptor interactions. (G) Detailed interaction between ligand and receptor. (H) Ligand action network showing direct and indirect regulatory effects on target activity
We further explored 59 signaling pathways in MDTS subgroup cells (Fig. 6C) and observed some pathways were dramatically elevated in high MDTS cells (e.g., COLLAGEN, CD99, LAMININ and CDH) or specific to the high MDTS (e.g., IL-6, EDN, and TENASCIN). In comparation of the relative positions of cell types in the 2D signal space, a substantial change in communication was observed (Fig. 6D). The network-related signaling pathways inferred from the epithelial cell populations between the two datasets were mapped onto a shared two-dimensional manifold and grouped, with the COLLAGEN pathways showing prominently (Fig. 6E).
Nichenetr analysis was performed to further explore the effects of different cell types on TME epithelial cells. Circos plot revealed different differential expression levels of each ligand and receptor in these cells (Fig. 6F). We found a high degree of interaction between MDK-TSPAN1 and CNN1-SDC4, suggesting that fibroblasts are the primary transmitter cells that influence epithelial pathway changes (Fig. 6G). The MDK ligand and CNN1 ligand reach the target receptor SDC4 through other receptors or other transcription factors. The transcription factors involved, such as TP53, MYC, and JUN (Fig. 6H).
Analyzing potential immunotherapeutic targets based on MDTS
We applied six algorithms to assess cell infiltration in target tissue. A higher proportion of cell infiltrates, such as B cells, T cells, fibroblasts, etc. were found in patients with low MDTS (Fig. 7A). Immune checkpoint molecules are regulatory molecules that suppress the immune system, and inhibiting these target molecules can activate immune function, namely ICIs. ICIs expression was higher in the low-MDTS group, such as TIGIT, PD-1, CTLA4, PD-L1, LAG3, CD96 (Fig. 7B). IHC was performed to support the above results using the representative cell markers and clinical ICIs (Fig. 7C).
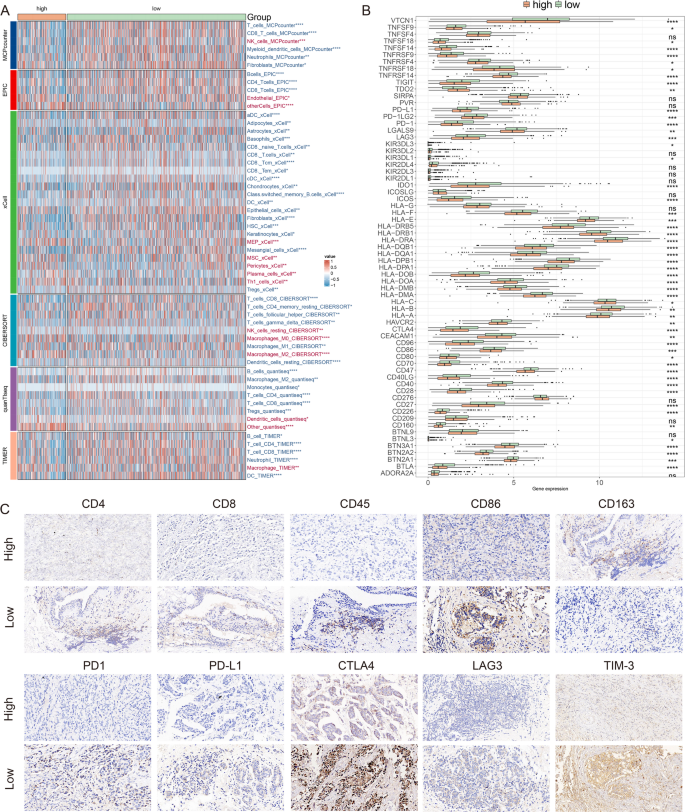
Differential expression and immunohistochemical analysis of immune markers in tumor microenvironments between MDTS subgroups. (A) Heatmap providing a comparative view of immune cell infiltration in tumor samples with low and high MDTS, utilizing various computational algorithms for quantification. Each row represents a different type of immune cell, with the color intensity reflecting the level of infiltration. Red text indicates increased infiltration in the high MDTS group, while blue text indicates decreased infiltration. (B) Box plots illustrating the distribution of gene expression levels for ICIs across low versus high MDTS conditions, with statistical significance denoted by ns for not significant; *P < 0.05; **P < 0.01; ***P < 0.001; ****P < 0.0001. (C) Representative immunohistochemistry images showcasing the staining intensity of various immune markers between high and low expression conditions, visually depicting the differential expression of these markers in correlation with MDTS levels
The results indicate that low MDTS patients had elevated ESTIMATE scores, immune scores, and stromal scores compared to the higher MDTS group but had lower tumor purity (Fig. 8A). It was confirmed by the TIDE algorithm that low MDTS patients were more sensitive to immunotherapy (Fig. 8B). Notably, patients with low MDTS combined with low TIDE had a higher survival rate than patients with other types (Fig. 8C). Results showed that low MDTS patients had a higher anti-tumor immune activity than high MDTS patients (Fig. 8D). It is common to use immunotherapy that blocks immune checkpoints. Next, we evaluated the ability of the MDTS to predict the immune checkpoint blocking response. In both the anti-PD-L1 cohort (IMvigor210) and anti-PD-1 cohort (GSE78220), MDTS was further assessed. The patients with a low MDTS showed significant therapeutic advantages and clinical benefits (IMvigor210: Fig. 8E-H; GSE78220: Fig. 8I-L).
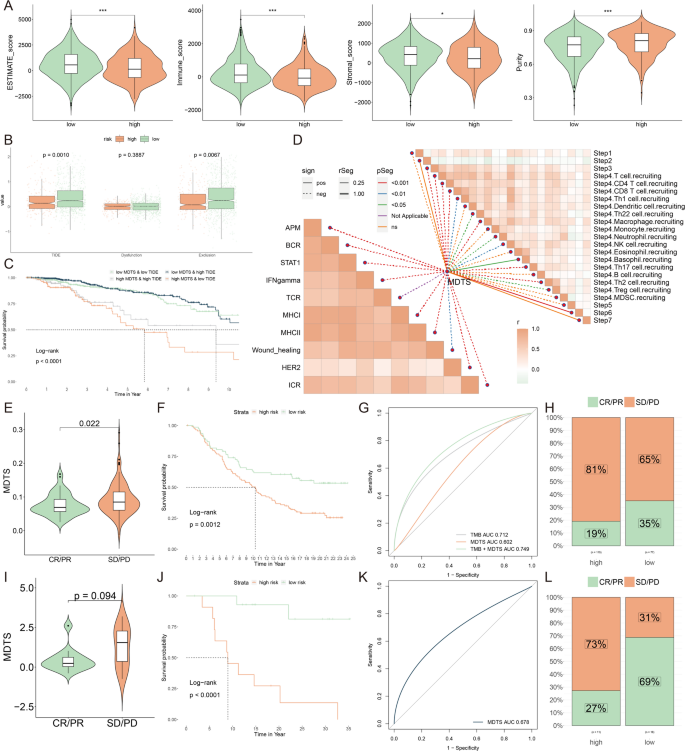
Analyzing potential immunotherapeutic targets based on MDTS. (A) Calculation of multiple functional scores, including ESTIMATE scores, immune score, stromal scores and tumor purity, was performed by the ESTIMATE algorithm. (B) Comparisons of TIDE, Dysfunction, and Exclusion score among the MDTS groups. (C) The survival probability curves of four combinations of MDTS and TIDE. (D) The correlation of MDTS with 7 steps of tumor immune cycle and 10 signaling pathways related to tumor immunology. (E, I) Violin charts display the relationship between MDTS levels and responses to anti-PDL1 (E) and anti-PD1 (I) therapies. (F, J) Survival probabilities of low and high MDTS patients in anti-PDL1 (F) and anti-PD1 (J) cohorts, respectively, illustrating the impact of MDTS on survival outcomes. (G, K) Analysis estimates the predictive ability of MDTS via AUC values, considering TMB combinations, in anti-PDL1 (G) and anti-PD1 (K) cohorts, evaluating the efficacy of MDTS as a biomarker. (H, L) The percentages of complete response/partial response (CR/PR) and stable disease/progressive disease (SD/PD) in anti-PDL1 (H) and anti-PD1 (L) cohorts are shown, based on MDTS levels, to assess treatment effectiveness
Identifying anti-cancer agents for high MDTS patients
In this study, we devised a targeted approach for breast cancer patients with high MDTS levels. Spearman correlation analysis showed a positive correlation between MDTS and the abundance of seven potential targets (SQLE, COX5B, DHCR7, NDUFA6, NDUFB9, CALR, P4HB), and there was a significant negative correlation with their CERES scores (Fig. 9A). It is suggested that these seven genes can be used as potential therapeutic targets for high MDTS patients. These seven genes are closely related to multiple pathways of drug action, and further analysis of these potential drug targets based on drug sensitivity ratios found that the vast majority of these seven genes have high drug sensitivity (Fig. 9B). So, they are considered as key therapeutic targets for breast cancer patients with high MDTS.
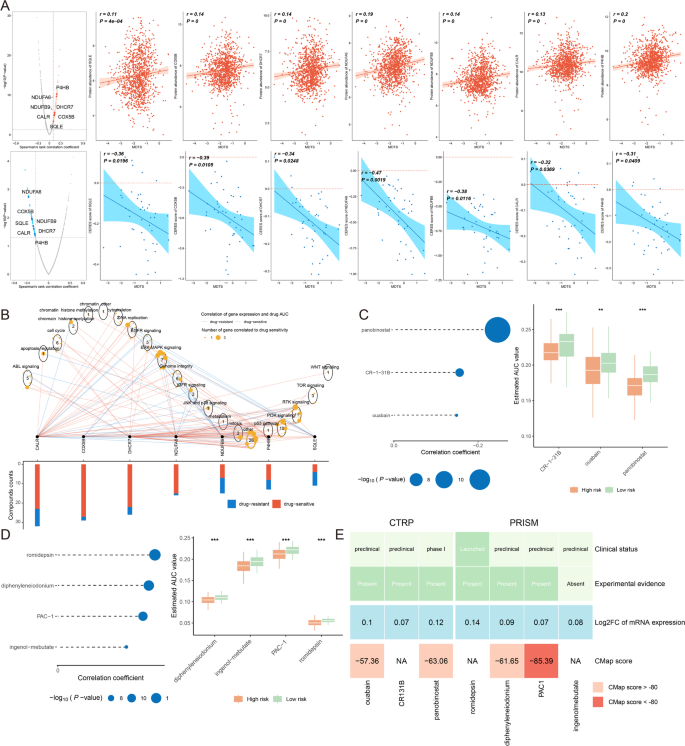
Identifying anti-cancer agents for high MDTS patients. (A) Spearman correlation of MDTS with seven potential therapeutic targets expression and CERES value (red: positive correlation, blue: negative correlation). (B) Network analysis highlights the intricate connections between these seven therapeutic targets and their associated drug action pathways. (C–D) Box plots compare the AUC values of identified compounds, sourced from the CTRP (C) and PRISM (D) datasets, between low and high MDTS patient groups. (E) A summary table outlines the multi-perspective analysis of the nine candidate compounds, detailing their clinical status, experimental evidence, mRNA expression levels, and CMap scores
Subsequently, we obtained 3 compounds (panobinostat, CR-1-31B, ouabain) from the CTPR dataset and 4 compounds (romidepsin, diphenyleneiodonium, PAC-1, ingenol-mebutate) from the PRISM dataset. It appears that high MDTS populations were more sensitivity to these seven chemotherapy drugs, since their AUC value was lower (Fig. 9C, D). Based on the CMap analysis, the clinical status, experimental evidence, mRNA expression level and CMap score of each compound were evaluated in detail (Fig. 9E). Ultimately, PAC-1 was identified as the most suitable therapeutic drugs for patients with high-MDTS, based on their CMap score (−85.39).


