Appendix I – experiments
In this section, we systematically explore the impact of various components in the segmentation pipeline on the accuracy of kidney tubule segmentation, utilizing a detailed and structured approach. We conducted experiments that cover three critical areas: the creation of the third channel, the selection of image encoders within SAM, and the necessity of specific pre-processing and post-processing steps. All pairwise comparisons between experiments were performed using the two-sided Mann-Whitney U test, unless otherwise stated.

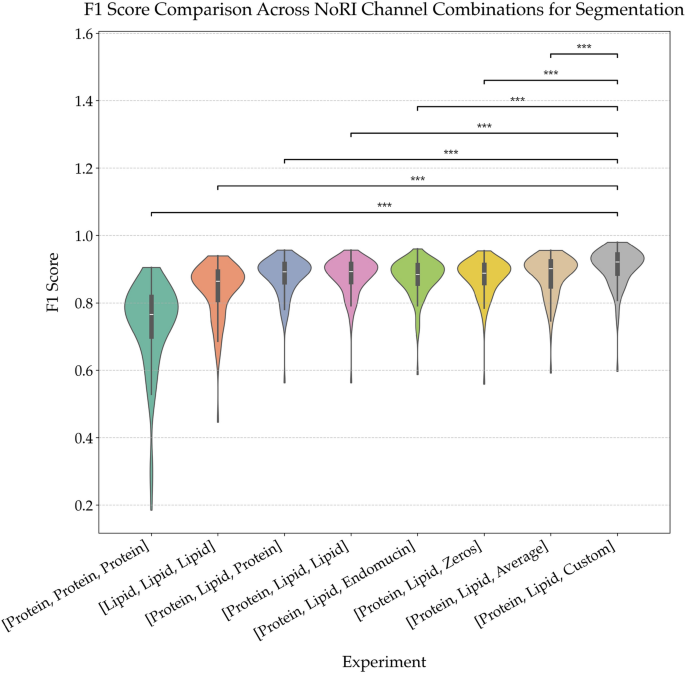
Comparison of segmentation performance across NoRI channel combinations. Violin plots of F1 scores from segmentation models trained on different combinations of NoRI input channels. The baseline models using only protein or only lipid channels underperform compared to those using both. Replacing the third input channel with either synthetic (Zeros), averaged, or domain-specific (Custom) data significantly improves performance, with the best results observed for the [Protein, Lipid, Custom] configuration. Asterisks denote statistically significant differences (*** \(p < 0.001\), ** \(p < 0.01\)), highlighting the impact of channel selection on segmentation quality. This demonstrates that biologically informed channel construction significantly improves segmentation fidelity.
Experiment 1: preprocessing ablations – third-channel construction
The Segment Anything Model (SAM) requires a three-channel image input. Since NoRI imaging provides only two channels–protein and lipid–we investigated multiple strategies for constructing a third channel tailored to biological tissue segmentation. The aim was to improve contrast and boundary detection in SAM’s input space while preserving biological fidelity.
We evaluated eight different third-channel configurations:
-
[Protein, Protein, Protein]: Monochromatic triplet using protein channel only.
-
[Lipid, Lipid, Lipid]: Monochromatic triplet using lipid channel only.
-
[Protein, Lipid, Protein]: Interleaved configuration favoring protein signal.
-
[Protein, Lipid, Lipid]: Interleaved configuration favoring lipid signal.
-
[Protein, Lipid, Endomucin]: Using an immunofluorescence channel as the third input.
-
[Protein, Lipid, Zeros]: All-zero third channel baseline.
-
[Protein, Lipid, Average]: Mean of the two channels.
-
[Protein, Lipid, Custom] (proposed): Pixel-wise multiplication of protein and lipid channels, with histogram equalization to enhance boundary contrast.
As shown in Fig. 6, the choice of third channel has a marked impact on segmentation quality. The custom method consistently outperformed all other variants, achieving the highest mean F1 score with the lowest variance. This improvement is statistically significant across most pairwise comparisons (\(p < 0.001\)). The pixel-wise multiplication strategy accentuated co-localized signal regions, enhancing edge definition critical for tubule boundary segmentation.
These results emphasize the importance of biologically motivated preprocessing when adapting generalist models to domain-specific imaging modalities. The success of the custom channel supports its use as a default strategy in future NoRI-based segmentation tasks.

Experimenting with Different Image Encoders in SAM: Violin plot illustrating the F1 score distributions for experiments with different image encoders in SAM. The configurations include vit-b (base), vit-l (large), and vit-h (huge). The plot highlights the variability and central tendencies in performance for each encoder type.
Experiment 2: evaluation of SAM image encoders
The SAM model offers three different image encoders–vit-b, vit-l, and vit-h–that vary significantly in their architectural complexity and computational demands:
-
vit-b: A base encoder with 91 million parameters.
-
vit-l: A large encoder with 308 million parameters.
-
vit-h: A huge encoder with 636 million parameters.
Each of these encoders was evaluated based on their ability to segment kidney tubules accurately and the computational resources required to do so. As shown in Fig. 7, the vit-h encoder consistently delivered the most accurate segmentation, with an F1 score of approximately 0.9226, surpassing the performance of both vit-b and vit-l. This difference was statistically significant compared to both vit-b and vit-l (Mann-Whitney U, \(p < 0.001\) for both). While the vit-h encoder is computationally intensive–requiring approximately 27 additional seconds per image on a GPU compared to the smaller encoders–this increase in processing time is justified by the significant improvement in segmentation accuracy. This trade-off is particularly relevant in research and clinical settings where precision is paramount, and computational resources are available. The superior performance of the vit-h encoder can be attributed to its ability to better capture and process the complex features within the images, thus leading to more accurate segmentation.

Ablation study evaluating the impact of different processing steps on segmentation performance. Violin plot showing the distribution of F1 scores across experiments with different processing steps. The experiments include no pre-processing, no post-processing, the combination of pre-processing, SAM segmentation, and post-processing, and the addition of ilastik cleaning. This analysis highlights the impact of each step on model performance, demonstrating the importance of a complete pipeline.
Experiment 3: ablation study on the segmentation pipeline
To understand the role of each step in the segmentation pipeline, an ablation study was performed (Fig. 8), where key components were systematically omitted:
-
Preprocessing Omission: Without preprocessing, the segmentation process failed entirely, indicating that preprocessing is critical for the model’s ability to correctly identify and segment kidney tubules. The preprocessing step, which includes histogram equalization and the creation of the third channel, enhances the contrast and quality of the input images, making the features more discernible for the SAM model.
-
Post-processing Omission: The omission of post-processing steps led to a significant decrease in segmentation accuracy. The segmented tubules appeared merged and less distinct, highlighting the importance of post-processing in refining the segmentation results. Post-processing steps are crucial for cleaning up the initial segmentation by removing noise and non-tubule elements, thereby ensuring that only the relevant structures are retained.
-
ilastik Refinement: The inclusion of ilastik for final cleanup significantly improved the segmentation quality, increasing the average F1 score from 0.9212 to 0.9226. While this improvement may seem modest, it is particularly impactful for images that initially had lower accuracy. The use of ilastik introduces a pixel-based classification that further refines the segmentation, reducing variability and enhancing the consistency of the results across the dataset.
These results indicate that protein and lipid concentrations measured from segmentations are statistically robust across variations in the pipeline. These small effect sizes confirm that automation does not introduce meaningful bias, validating the pipeline’s use for biological inference. The ablation study clearly demonstrates that each component of the pipeline is essential and contributes uniquely to the overall accuracy of the segmentation task.
Experiment 4: comparison with cellpose-SAM
To contextualize pipeline performance against an established baseline, we compared our fully automatic segmentation against Cellpose-SAM14, a widely used general-purpose instance segmentation tool for biological images. Both methods were evaluated on the same 100-image test set using instance-level F1 and Soft Panoptic Quality (SoftPQ)7, a continuous variant of panoptic quality that awards partial credit for overlapping but unmatched instances, making it more sensitive to partial detection failures.
Our pipeline achieved a mean F1 of 0.9226 and SoftPQ of 0.8946, compared to 0.1587 and 0.1423 for Cellpose-SAM. The large gap reflects that Cellpose-SAM is designed for general cellular morphology and lacks the domain-specific preprocessing and channel construction steps that are critical for NoRI images. In particular, without the contrast-enhancing third channel and ilastik-based filtering, Cellpose-SAM struggles to distinguish densely packed tubules from background and lumen regions (Fig. 9).

Impact of ilastik filtering on tubule count accuracy. Percentage error in automatic tubule counts compared to ground truth, shown for models without (left) and with (right) ilastik-based filtering. Without ilastik, the mean error is higher (4.42%) with greater variability, particularly in low-count images. Incorporating ilastik reduces both the mean error (0.73%) and standard deviation, improving consistency across the full range of tubule densities. These results demonstrate that ilastik filtering enhances segmentation accuracy, especially in challenging regions with sparse or ambiguous tubules.
Experiment 5: comparing biological outcome – ground truth vs fully automatic
To assess the impact of segmentation accuracy on downstream biological measurements, we compared protein and lipid concentrations obtained from three segmentation approaches: manual ground truth, fully automated segmentation using SAM, and the automated pipeline with ilastik refinement. This comparison was performed to determine whether deviations in segmentation accuracy influence the resulting biochemical measurements.
The results indicate that protein and lipid concentrations measured across these methods are highly consistent. The effect size between manual and fully automated segmentation was small (Cohen’s d = –0.053), suggesting that the differences introduced by automation do not substantially alter the biochemical readouts. With the addition of ilastik-based refinement, the effect size compared to the manual segmentation further decreased (Cohen’s d = 0.008). The difference between the SAM-only and SAM+ilastik methods was similarly modest (Cohen’s d = –0.046).
These findings indicate that although there are small differences in segmentation masks as reflected by F1 score, the overall conclusions regarding protein and lipid distributions remain unchanged. The automated pipeline can therefore be used with confidence for large-scale analysis where manual annotation or correction is not practical.
The results from these experiments collectively provide a comprehensive understanding of the factors influencing kidney tubule segmentation accuracy using the SAM model. The creation of a third channel through a custom method involving multiplication and preprocessing proved to be the most effective approach, highlighting the importance of enhancing contrast and combining multiple data sources to improve segmentation quality.
The evaluation of different SAM encoders revealed that the vit-h encoder, despite its higher computational cost, offers the best performance in terms of accuracy, making it the preferred choice when resources allow. The ablation study underscored the necessity of both preprocessing and post-processing steps, with each playing a crucial role in achieving high segmentation accuracy. The refinement introduced by ilastik, although seemingly minor, significantly enhances the consistency of the results, particularly for more challenging images.
Overall, this study presents a robust and reliable segmentation pipeline that, when fully implemented, achieves an F1 score of 0.9226, closely aligning with the ground truth. A direct comparison against Cellpose-SAM, a widely used biological segmentation baseline, is provided in Experiment 4 (Appendix I). These findings not only validate the chosen methodology but also provide a solid foundation for further research and application in biomedical image analysis, particularly in the accurate segmentation of kidney tubules. The insights gained from this study can inform future efforts to optimize segmentation pipelines and improve the accuracy of automated image analysis in complex biological datasets.
Appendix II – code, data and visualizer
To support reproducibility and encourage further exploration, we have made all relevant resources publicly available. The full codebase used for our analysis can be accessed on GitHub, along with a dedicated repository for the NoRI visualizer that enables detailed exploration of individual tubules. Additionally, the dataset used in our experiments has been uploaded to Zenodo.